Why You Need This Strategy
The S&P 500 is having its worst start to the year since 1988, currently -10% as at today’s close. The decline is greater than seen in 2008 and during the COVID collapse of 2020.
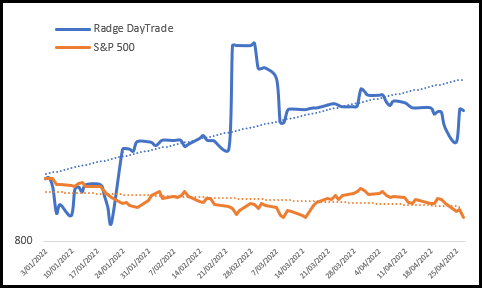
The following real-time equity chart, whilst quite ugly, shows my personal day trade strategy which, year-to-date, is +29.94%.

The irony here is that this strategy is ‘long only’. There is no short selling involved.
In this article I’ll attempt to explain how it’s possible for certain ‘long only’ strategies to be profitable in bearish environments and therefore why they’re valuable in a suite of strategies.
Back in 1998 I had been studying various systematic price patterns from the likes of Larry Williams, Toby Crabel and others. I noticed that after US market weakness, the Asia Pacific markets, notably the various stock index futures, would tend to gap down, yet close higher most of the time.
I created a strategy that bought the gap down and exited at the close. It proved quite successful on the Australian SPI, Hang Seng, Nikkei 225, Taiwan Index and even the Singapore Index. Yet the anomaly faded into Europe, most likely as Europe was still trading when the US markets opened.
Key Idea
My working hypothesis, or Key Idea as I like to call it, was that market participants tend to overreact on bad news. Which also coincides with the old motherhood statement, “Amateurs open the market and professionals close it.”
I’m not into motherhood statements but I am into rigid testing and accumulating data, and the data showed that there was a trading edge available.
2001
In 2001, I transitioned from trading futures to equities and I shelved this idea. In 2008 when my trend systems switched off I had ample time to research and came back to this idea but using equities. This was the start of my journey into shorter-term mean reversion trading and eventually into day trading.
What I learned was that equities also overreacted to negative news and, in times of duress such as sustained bear markets, that effect was exacerbated. Add to this trade frequency and we’re left with a technique that makes solid profits during bear markets.
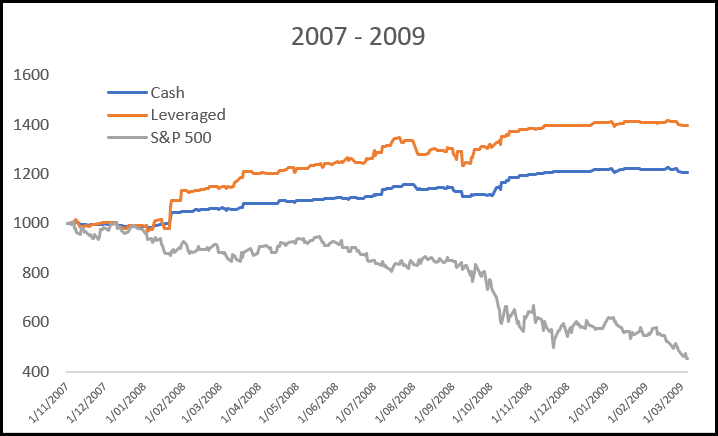
So let’s look at the data. We’ll use the Day Trade (Long) Turnkey Strategy straight from the box – no additional Radge tweaks. We’ll test it on the Russell-1000 (including historical constituents from Norgate Data) from the peak in November 2007 to the absolute low in March 2009.

During this time the S&P 500 declined by some -50%. The Day Trade (Long) strategy however returned +20% unleveraged, and almost +40% when leveraged.
Tech Wreck
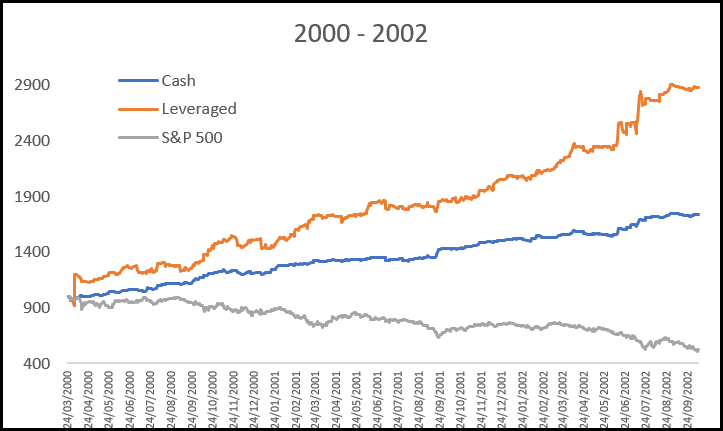
Let’s take a look back to the Tech Wreck where the market peaked in March 2000 and finally bottomed in October 2002 for a decline just shy of -50%. The unleveraged Day Trade strategy returned +73% for the period, and the leveraged version returned +188%.

So far this year almost all of my trend systems are losing money. Some as much as -30%, however, the allocation to my personal day trade strategy means the full portfolio is down just -8.6%.
If the market continues to fall or swings into a sustained bear market, then the trend systems will take defensive action yet the day trade strategy should continue to perform, and voila!, I will potentially have a positive year. If the market rallies, like it did in 2020 after initial falls, then the trend systems will take the lead.


