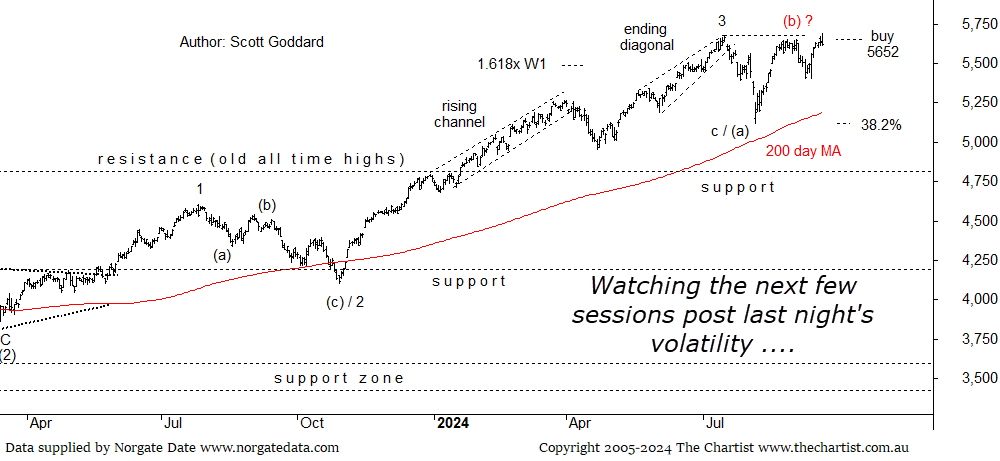
US Stock Market – Technical Outlook
With the S&P500 once again hitting all time highs, this article comes from Scott Goddard who is our Global Market Analyst. Scott’s analysis is part of our Chartist Pro (AU & US) and Chartist US Memberships.
Bottom Line
September 19th 2024:
Daily Trend: Up
Weekly Trend: Up
Monthly Trend: Up
Support Levels: 5119 /4953 / 4800 (zone)
Resistance Levels: N/A (all-time highs)

Technical Discussion
Reasons to remain longer-term bullish:
→ Elliott Wave count is bullish bigger picture via our ongoing analyses
→ 4800 zone (old all-time highs) has now reverted to major support
→ interest rates and global political issues remain front and centre
→ immediate Wave-4 requiring more time to complete is our preferred stance yet watching
As anticipated, financial markets experienced volatility following the Federal Reserve’s decision to cut interest rates by 50 basis points last night, bringing the range to 4.75%-5.00%. The central bank expressed increased confidence that inflation will continue to trend toward its 2% annual target. Looking ahead, they signalled the possibility of two to three additional 25 basis point cuts in upcoming 2024 meetings, reflecting a cautious approach in light of ongoing economic uncertainty.
We are certainly at a very interesting juncture here from a technical point of view. Our preferred stance has been that this immediate Wave-4 was still going to require more time to complete. Likely forming as a more complex yet shallow (a)-(b)-(c) ascending triangle or perhaps a flatter type pattern. Yet we also remain open to the possibility that the Wave-4 has already completed with price action now subdividing to the upside as part of an intermediate Wave-5. Both are valid trend interpretations be it we are continuing to lean more toward the former than the latter. We should have our answer though within the next week or so.
Price pushed into new all-time highs last night in anticipation of a 50 basis point rate cut, yet it is always worth being cautious when expectations are met as part of any critical reporting. Mainly due to the fact that markets are forward-thinking beasts. So when the announcement became official it was soon met with some profit taking with the Index closing on its lows at 5618. U.S. futures markets are solidly up at the time of typing this review so I will be watching with interest to see whether this strength can be maintained by the close of the cash markets tomorrow morning Australia time. We do have some Type-A bearish divergence hanging around on the weeklies at the moment which has yet to trigger so we will be watching to see if this ends up triggering or whether it simply extinguishes via the Bulls categorically taking control of things again more immediately. We will know soon enough.
If you’re interested in receiving daily ASX and US Chart Research, sign up for our free trial.

