

US Stock Market Technical Outlook
US Stock Market Technical Outlook
Bottom Line
August 8th:
Daily Trend: Down
Weekly Trend: Down
Monthly Trend: Up
Support Levels: 4953 / 4800 (zone)
Resistance Levels: 5566 / 5670 (all-time highs)
Technical Discussion
Reasons to remain longer-term bullish (caution more immediately):
→ Elliott Wave count is bullish bigger picture via our ongoing analyses
→ 4800 zone (old all-time highs) has now reverted to major support
→ interest rates and global political issues remain front and centre
→ recent downward surge has been concerning yet for now the price chart is holding together
As we mentioned on Tuesday, due to the bears suddenly appearing out of the woodwork combined with immense volatility, we are covering the S&P-500 twice this week. So picking up from Tuesday we were looking to see if things were going to settle somewhat especially as even though Tuesday’s price bar was aggressive to the downside, it did have some buyers come in off its intraday lows circa 5119. So on Wednesday, we did witness such a reprieve, and even though last night started off strong, the session was sold back into pretty quickly.
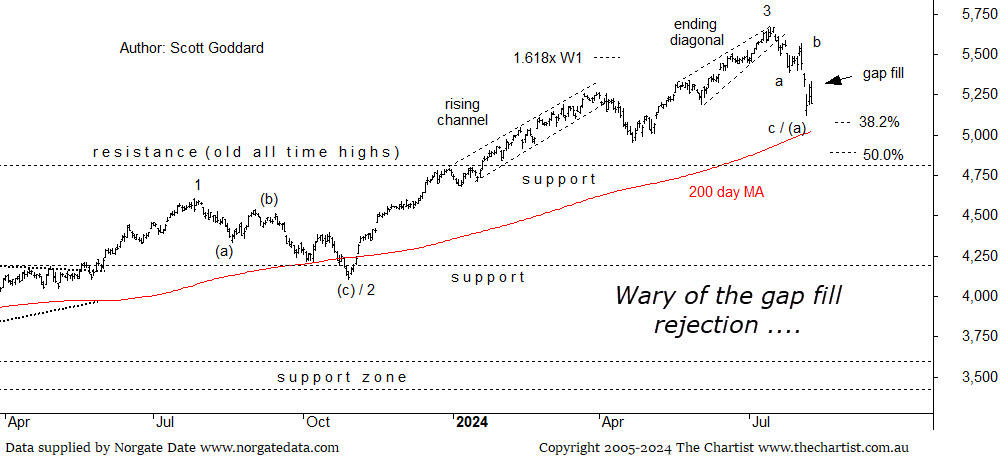
Last night’s volume though wasn’t overly high, yet volume is something we will be keeping a close eye on over the upcoming sessions as any solid increase with price continuing to head south will be concerning. We mentioned in our videos on Tuesday that we would be watching closely to see how price responds to any upcoming gap fills. Well, we did witness the most recent being filled over the last two sessions yet unfortunately last night the final fill was clearly rejected. It means we keep an open mind that as a bare minimum, the recent lows may need to be retested to see if those intraday buyers on Tuesday return. Either that or price action still needs lower.
We haven’t quite tagged the typical Wave-4 38.2% retracement zone yet circa 5072, with the 50.0% retracement also a possibility circa 4887. Although ideally, price continues to hold above the latter without tagging it. Any trading below the latter though will definitely be a red flag for mine. We do still have some Type-A bullish divergence in play on the dailies although it is not the strongest example. Our weekly divergence though may need quite a few more weeks before it fully unwinds back to oversold which would be ideal. We mentioned the Laws of Alternation in our last review as well which dictates that this Wave-4 should be a complex process (see video) and continue to evolve more sideways for a period of time. A scenario that is quite typical as well when markets are hit with a shock selling event like we have seen over the past week. The 200-Day MA continues to act as dynamic support so we are especially interested to see if this can continue to hold strong circa psychological 5000. Still plenty of work to do here by the looks of it before we are convinced that all is still well!
Scott Goddard is the Global Markets Technical Analyst at The Chartist. His analysis is available to members on the Free Trial or as part of our Chartist US and Chartist Pro (AU & US) membership options.

