

S&P500 Chart Review
This article comes from Scott Goddard who is our Global Market Analyst. Scott’s analysis is part of our Chartist Pro (AU & US) and Chartist US Memberships.
Bottom Line
13/3:
Daily Trend: Down
Weekly Trend: Down
Monthly Trend: Down
Support Levels: 5119
Resistance Levels: 6148 (all-time highs)
Technical Discussion
Reasons to remain cautiously bullish (red flag starting to wave below 5485)
→ Elliott Wave count is bullish bigger picture for now
→ 4800 zone (old all-time highs) is now acting as major support
→ interest rates and global political issues remain front and centre
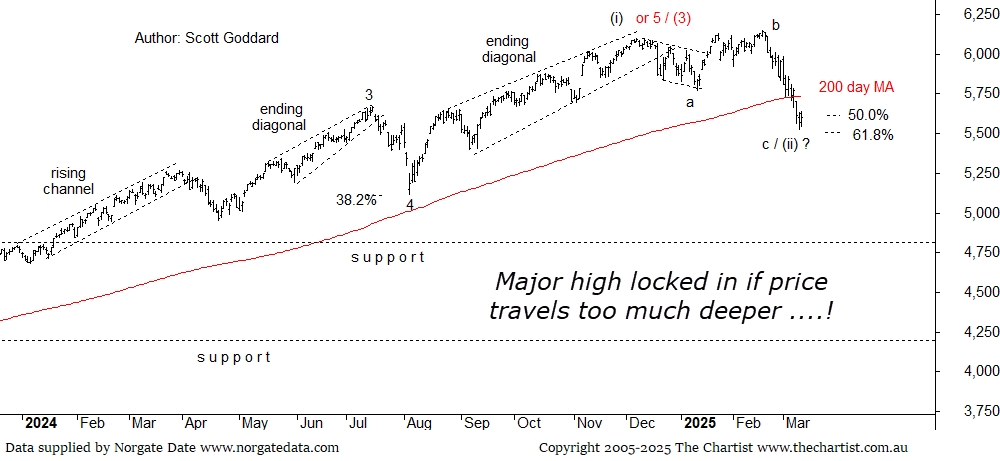
→ higher degree Wave-(3) move north may have now locked in as a high point if things continue to deteriorate
Last night the Labor Department’s Consumer Price Index showed consumer prices cooling more than analysts expected, providing reassurance that inflation is headed in the right direction and keeping hopes alive that the U.S. Federal Reserve could cut its key interest rate this year. So, we witnessed a minor bounce last night on this lower-than-expected inflation read combined with some very tentative dip buying. As we know, U.S. equities have come under pressure amid the rising concerns of tit-for-tat tariff disputes between the United States and its trading partners, scaring off investors and giving rise to fears that the resulting price jolts could tip the United States, along with Canada and Mexico, into recession. It’s certainly some show going on out there at the moment and global markets have been copping the brunt!
With Wednesday’s small advance, the S&P 500 is 8.9% below its all-time closing high reached less than a month ago. On Monday, the bellwether index dipped below its 200-day moving average, considered a significant support level, for the first time since November 2023. So not a great look although if price can start recovering from here and start trading back above this important line in the sand, then the temporary break below will be defined simply as a minor hiccup only.
As with the Nasdaq Composite Index which we are also reviewing again tonight, we have shifted the Wave-4 on the S&P-500 back to its original position. So, this provides scope for the depth of this immediate corrective move to still remain within the boundaries of an acceptable pullback for a wave-(ii). As such, with the newly adjusted 50.0% – 61.8% coming in at 5600 and 5485 respectively, we will continue to remain positive above 5485. I have to say though that this 3-week bout of impulsive downside weakness is starting to look quite concerning due to it being so impulsive, yet it is worth noting as well that wave-c’s can produce price action similar to this. Interesting to note as well is that with the previous ending diagonal move north, when these patterns trigger, they do generally retrace at least 50% of the pattern or even down to the full length of the pattern. And so here we are pretty much spot on target for this move. So right at this juncture we cannot cut the S&P-500 any more slack. Buyers either start to appear or we will be locking in the higher degree Wave-(3) at the recent highs way earlier than expected which will put somewhat of a dent in our short to medium term bullish aspirations! S&P-500 futures at time of typing is trading 33 points in the red!
Trading Strategy
As stated in our review tonight, things have continued to deteriorate post our last review a week ago. Our shifting of our Wave-4 back to its original position has bought some reprieve in regard to the acceptable depth of this move, yet it is still looking very precarious indeed. Naturally enough there are no trades to be had here with no low-risk patterns having developed, so it is now just a matter of whether our deeper end wave-(ii) target is going to be able to hold or not circa 5485!

