
Random Stock Charts of Interest
Let’s take a look at a few charts of interest. These are just some charts that I’ve been flicking through that sort of appealed to me. We’ll cover some ASX stocks. and a few U.S. stocks as well.
The first one though, although it’s already broken out, this is what I want to talk about to start with, because these consolidations, there’s a lot of those going on at the moment. Ideally, when we see them at all new time highs, it’s a pretty good sign, and we’re going to see a few of these.
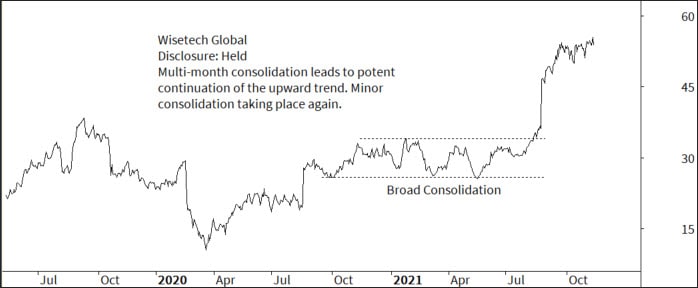
So this is WiseTech Global listed on the ASX. You can see this big, broad consolidation that took place between October last year and July, August, this year, when we’ve got the beak solid breakout prices moved from $32 – $33 to where they are now, and another minor consolidation taking place. This is just for background information, because a lot of the charts we’re going to look at are going to be showing these consolidations taking place right now.
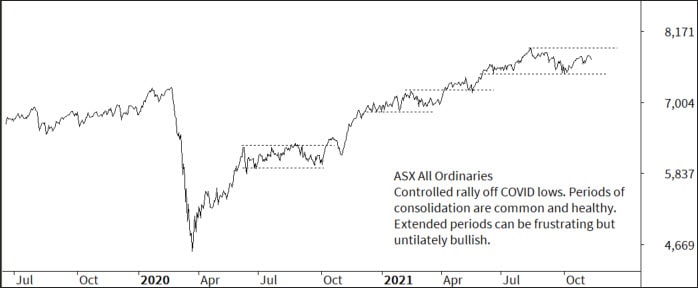
So here we’ve got the Australian All Ordinaries Index for our overseas visitors, this is similar to the S&P 500, so the top 500 companies in Australia. Now, one thing you may notice on this chart, is that we’re not too far above the 2020 highs. Now it’s very important to understand that the Australian market’s a little bit different, because Australian stocks pay very high dividends, and this chart does not show those dividends.
If we were to include the dividends, the market would be significantly higher to what it’s showing right here at the moment. So what we’ve got is a nice, steady trend off those COVID lows. We’re seeing periods of stepping up, consolidations, step higher, consolidation. That’s very, very common price action. And it’s also very, very healthy.
They can be a little bit frustrating, but ultimately they’re bullish. And we’ve got that going on here at the moment in this broader index. One other thing to remember with this Australian All Ordinaries Index, is the top 20 or so stocks are so heavily capitalized that they basically drive the market.
So there’s a lot of names out there that are doing exceptionally better than what the broader index is doing, simply because they don’t have the impact. So good stepping trends, nothing to be concerned of here, unless we see that minor little bit of support that we’ve been in, in the last few months, broken. But for all intents, we’re just consolidating, and looking for a breakout to come sooner rather than later.
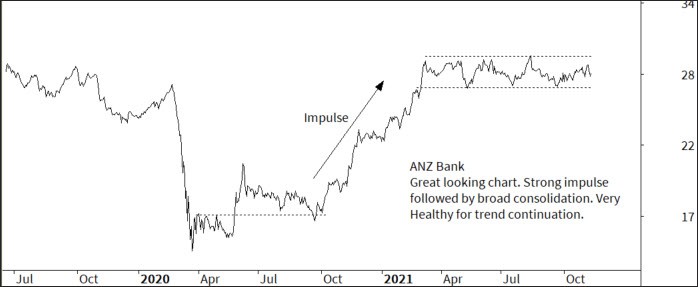
Here is ANZ, and this is one of the bigger cap stocks. And it’s a great looking chart, you know? The bottom line is the broader, longer the consolidation, the bigger the trend will be, either up or down. Usually if we have a consolidation after an uptrend, we would expect that trend to continue to the upside. So ANZ here, sitting in a consolidation for most of this year, we’re midrange at the moment, nothing to do.
The risk here is if you’re buying, that it remains in a range for an extended period of time. So we tend to wait for the breakout on the upside, but aggressive traders could probably lean against that support, putting a tight stop loss underneath it. But again, very healthy impulse there, very healthy consolidation. It’s just a matter of patience, to wait for that breakout to the upside, if and when that does come.
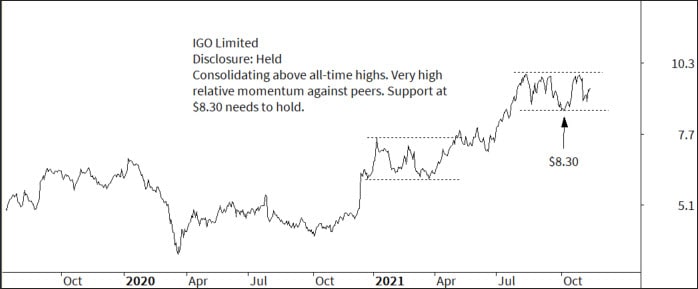
IGO Limited. This is one I do hold. We’ve got this consolidation going on. The most important piece of information here is that support and $8.30. We need to see that hold. The reason why I hold this stock, it’s in my ASX Momentum position, is one of momentum. It’s got very, very strong relative momentum against other stocks in the ASX 100. Again, nice consolidation going on. Not sure how long that will last for, but looking for break to the upside, and potentially new highs. You can see this consolidation is taking place well above old highs. In fact, the consolidation we saw back in early 2021 was also above those early 2020 highs as well.
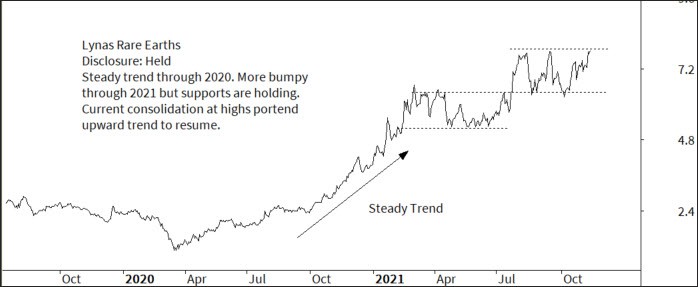
Lynas Rare Earths is another one that I hold. Very steady trend, very good performance off those COVID lows, and its supports our holding. It’s been a little bit more volatile this year, a little bit more range bound, and probably a little bit more frustrating. But we are approaching that line of resistance of the top end of this consolidation, and that does suggest that the upward trend will continue. Whether or not we just go into some steady trend again, or whether we take a step higher and then consolidate, no one can know that. But at this stage, the trend is up and stepping higher.
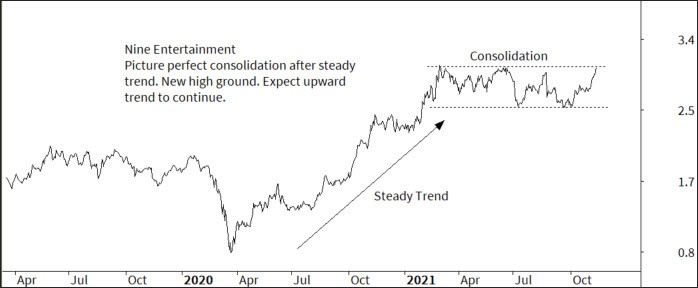
Nine Entertainment. Very good looking chart here, very similar to ANZ, nice steady trend through 2020, consolidation through 2021. 2021 has been a pretty frustrating trading market for a lot of people.
Certainly some of my portfolios have been underperforming simply because I’ve been caught up in some of these consolidations. But these are very healthy in the bigger picture. So we would expect an upward trend to continue here. You can see by this chart that we are actually testing that line of resistance at all time highs.
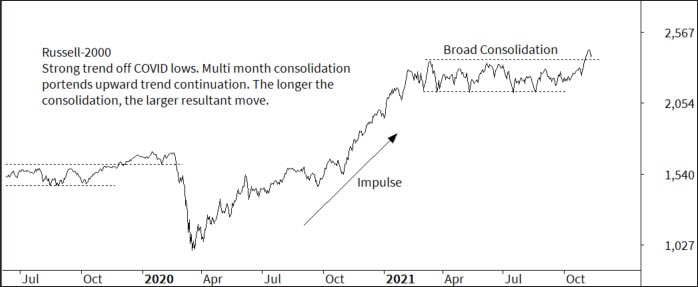
Let’s have a look at the U.S. market, specifically the Russell 2000. This is a chart that we’ve been following for quite some time, very strong impulsive trend off the COVID lows back there in March, April. We’ve now got this multi-month consolidation taking place. That does suggest that a further trend upward will continue. As I said earlier, the longer the consolidation, the larger the move tends to be.
Now, we’ve got an upward breakout of this one. So for all intents, an upward move is coming. We’re just pulling back to that line of what will now be support, old resistance. That is very, very common, very typical, and it can lead the way to a very low-risk entry opportunity. So hopefully we’ll see this line of support here hold. If it does then look for higher prices in the coming months with the Russell 2000, that’s obviously the small cap index.
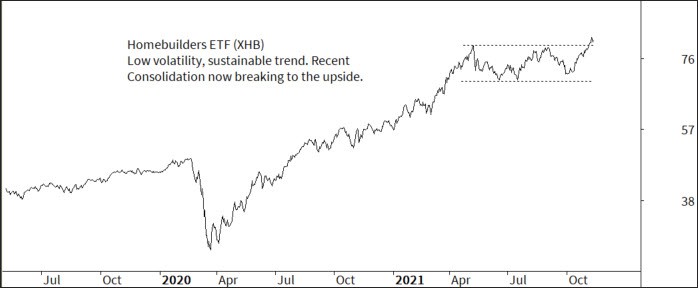
Another one that’s come up is the home builders ETF in the U.S. The code there is XHB, very low volatility ETF, very sustainable trend. That nice consolidation is now breaking to the upside. So that is a tick for the U.S. economy.
We’re seeing home prices over there accelerate, as we are around the rest of the world, very low supply, and obviously low interest rates. So we’ll see how this one pans out, but breaking to the upside portends further trends to the upward way coming along.
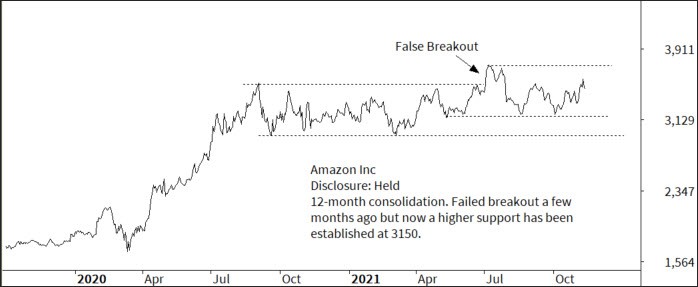
Here we’ve got Amazon. This is another one that I’ve held for quite a number of years. We’re in this broad consolidation, have been since around July, August last year. We did get a breakout, but that failed to get on with it. If I’m looking for a benefit here, we’ve got this kind of support, a higher support. now at 31.50, and prices are consolidating above that. So a little more room to move here. I think
Amazon really needs some kind of a new push higher from a fundamental perspective. I’m not sure whether its new car project will be that push, but it certainly needs something to get it going again, some kind of news for that price to move higher, but even so technically it’s a good consolidation. Wait for a breakout. See if you can’t become another market leader like it has been for the last, you know, five or six years.
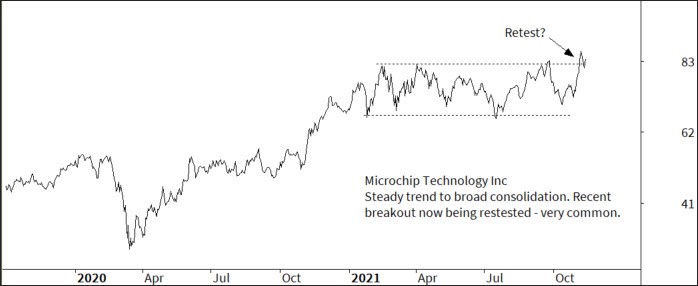
Here we’ve got our Microchip Technology, MCHP.
Nice trend higher, same picture, broad consolidation, recent breakout now being tested or retested, and that’s very, very common. So as long as that support holds, then there’s no reason why the share price can’t keep going higher. I really like the looks of these kinds of charts at the moment. Applied Materials, one we have been holding of late, not holding right here at the moment, recent strong breakout of the consolidation, as you can see. That was preceded by a very, very strong trend. So potentially look for a retest of that breakout. If we do get that, a low risk entry would be available and on a relative momentum basis, this one stands right at the top of the list. So potentially one to keep an eye on that’s for sure.
That’s all we’ve got there for you today. So I hope you enjoy that and happy to answer any questions for you.


