Probability Trading
Today we are going to look at my least favorite branch of mathematics…
Probability….
Probability has a way of turning a seemingly simple problem into a downright confusing mess. But its importance in trading is both crucial and obvious.
An important part of trading is keeping your expectations in check, and a misunderstanding of probability can often mislead expectations, either intentionally or unintentionally.
I recently came across a strategy being sold online that advertised a fantastic return and win-rate of 80%. So, what’s that problem? The strategy only had 20 trades.Whether intentional or not, this is an example of sample bias. The narrow sample size of trades presents inaccurate backtest metrics.
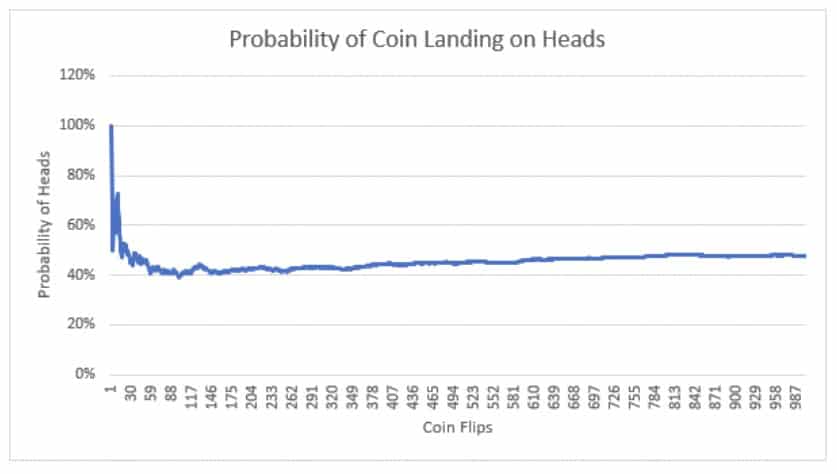
Assume I flip a coin twice and get tails both times. Within this experiment, I demonstrated that the win-rate of tails was 100%. Obviously, this is incorrect. So, I retest again, get four out of five heads, and now conclude that the probability of heads is 80%. You get the point.
Probability of a Coin Landing on Heads
The graph below demonstrates the probability of the coin landing on heads as the experiment progresses. We can see that as the sample size grows, the probability reverts towards the mean (50%).

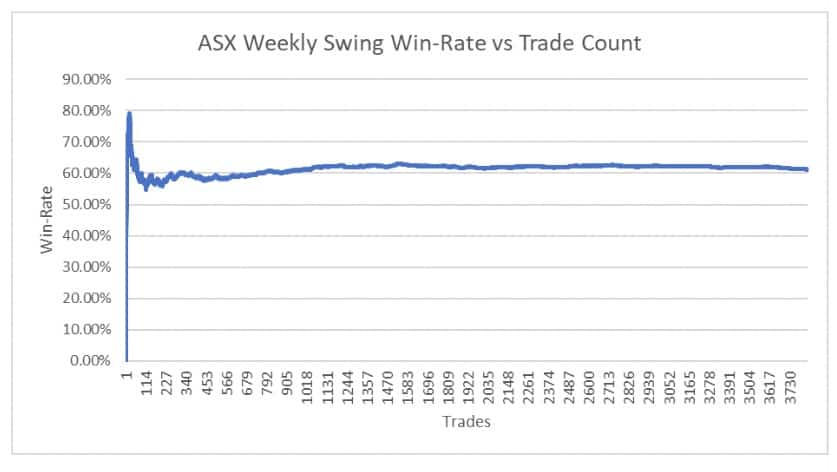
Now let’s do the same for our ASX Weekly Swing Strategy. Overall, the strategy presents a win-rate of 61.23%. Using RealTest and Norgate Data, we’ve simulated all the trades back from the year 2000 onwards, a total of 3,801 trades. Just like the coin toss experiment, the win-rate of the strategy swings wildly in the initial stages, but steadies as the sample size grows. After 25 trades the win-rate sat at 80%, and did not drop below 70% until after 30 trades (sounds familiar).
ASX Weekly Swing Win-Rate vs Trade Count

So, what have we learnt? A robust strategy is valid over a long period of time and across many trades.
The narrowing of testing windows introduces sample bias, which can mislead expectations regarding the performance of the strategy over any reasonable length of time.

