Seasonality – Is December the best month for investing?
There are a few seasonal patterns that are often discussed within the stock market. “The Santa Rally”, “The January Effect”, “The September Effect”, and “sell in May and go away” are all common examples often seen, but is there any truth to them?
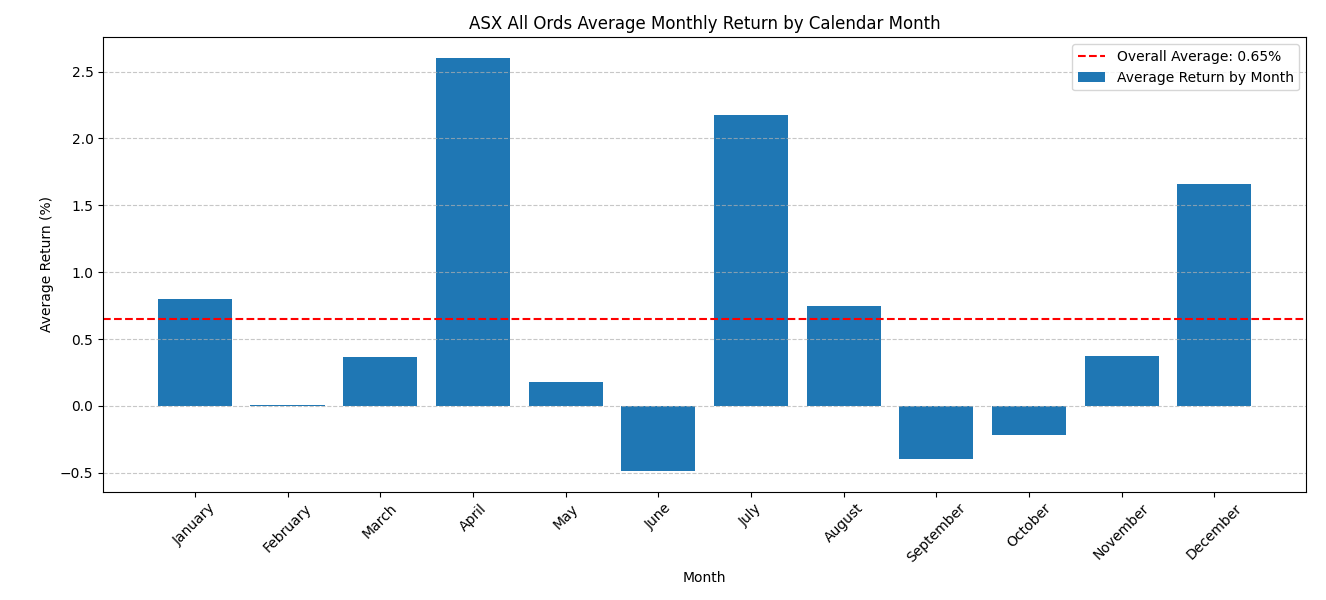
The chart below shows the average return of each calendar month for the ASX All Ordinaries. Looking at this, we can see that:
- The three months, June, September, and October, are negative on average.
December is on average a positive month, but not to the same magnitude as April or July.

So, does this mean we should exit our investments at the end of August and re-enter in November? Let’s explore the data a bit further to better understand.

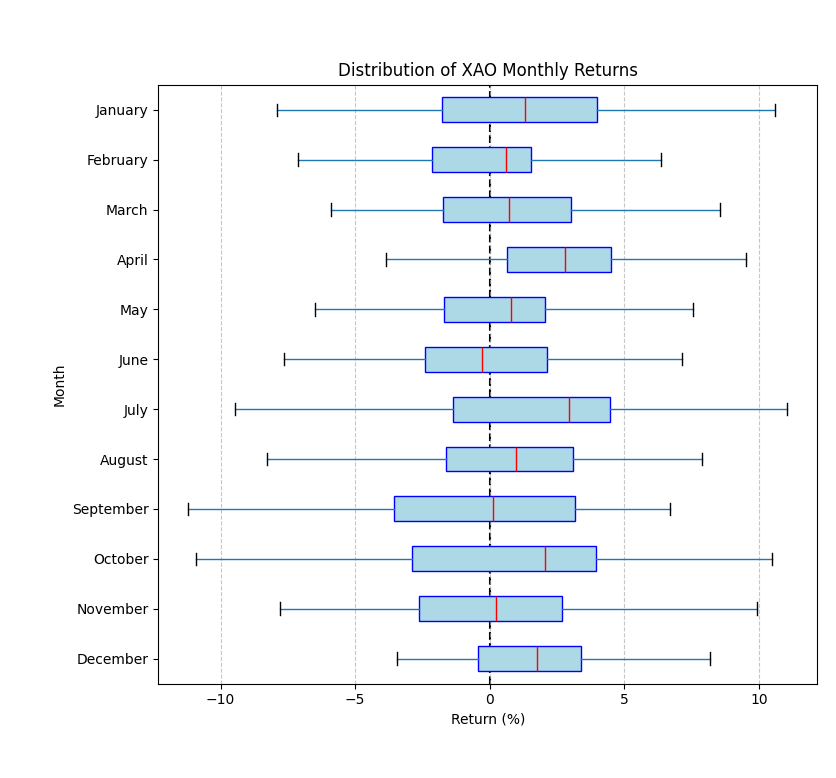
The above box plot breaks out the monthly returns so we can better see how they are distributed. The boxes here represent the middle 50% of returns, while the whiskers represent the remaining 25% on either side. Immediately it is clear that by using only the average we are not seeing the full picture. Every month still has a reasonable chance of finishing with a loss, and months showing an average loss on the previous chart still have a reasonable chance of finishing with a strong gain. The red line on each box shows the median or middle value of the data. From this, we can see that only one month, June, has a negative median, meaning every other month has a positive return more than half of the time.
Given this, it appears that monthly seasonal patterns are not as strong or clear as they may seem on the surface. Broad rules or investment ‘tricks’ rarely work with any consistency, and if they did, have likely been exploited to the point of no longer being useful.

