Is a Stretched 200-day Average a Proxy for a Trend Reversal?
In the last week several commentators have been discussing the extreme distance between the NASDAQ and its 200-day moving average. Theory is that when the index is stretched far above its 200-day moving average it’s more liable to snap back.
Let’s take a look at:
(a) Does an extreme stretched differential lead to a major reversal, and
(b) Are major corrections preceded by extreme readings in the differential
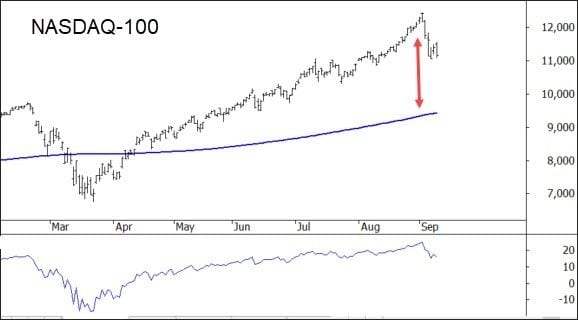
The following chart shows the current NASDAQ-100 with its 200-day moving average. The lower pane shows the percentage differential which just pushed through 20%.

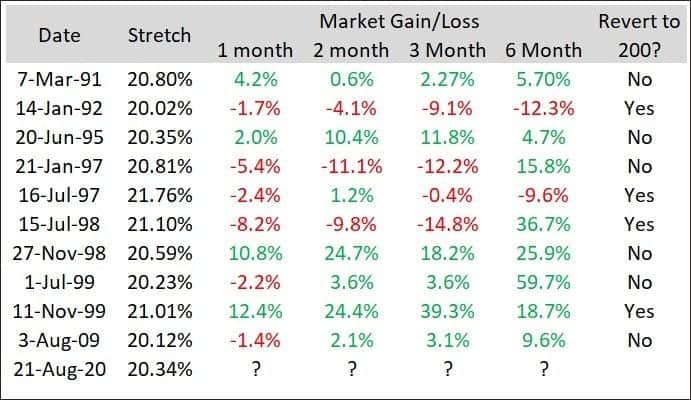
The first table does indeed suggest that the stretch, or differential, above 20% is quite rare. Since 1998 its only occurred 11 times and only two have been in the last 20-years.
That said, it’s not an overly compelling indicator that a correction is imminent. The month following an extreme reading, the probability of a fall is about 50/50. This deteriorates even further with time. The table does however suggest that when a strong bull market is in place, such as 1998 – 1999, prices can remain stretched for an extended period of time. That should be of no surprise to anyone that has researched overbought/oversold indicators.

Let’s now turn the question around.
Are large corrections, say greater than 15%, preceded by large differentials between the price and the 200-day moving average?
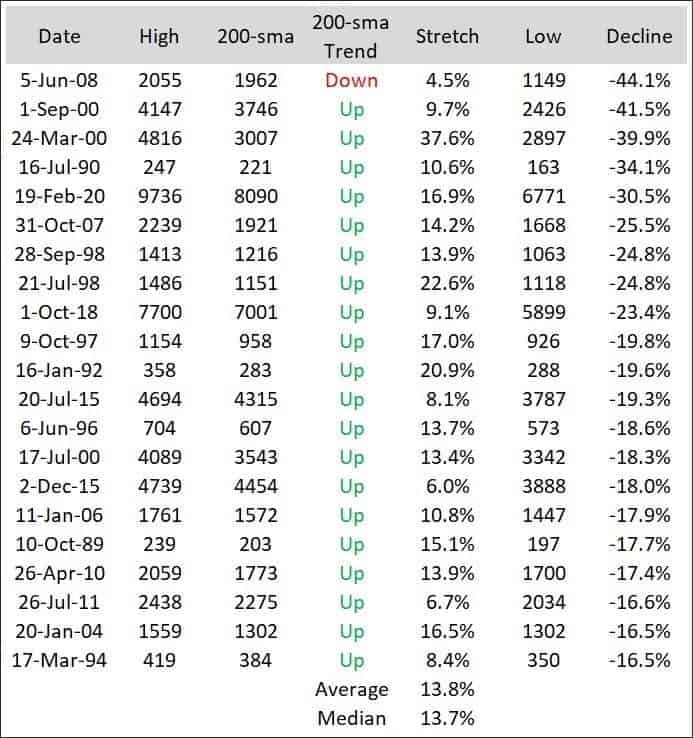
In the following table we look at all corrections greater than 15% where the correction starts above the 200-day moving average. We then look back to see what the stretch was prior to the fall.
The largest correction comes within a bear market during the GFC. The stretch was just 4.5%. In all other cases the market was trending higher. Whilst there are some extreme readings, such as that at the top during the Tech boom, most are well below the 20% so-called ‘extreme’ threshold.
The average stretch above the 200-day prior to a significant correction is 13.8%.

In summary, using the differential between an index and its moving average doesn’t appear to offer any strong evidence of a possible major correction. It may add some weight of evidence’ when used in conjunction with other breadth or sentiment indicators.


