Global Stocks Just Got Messy
After a year of calm it seems someone, or something, has disrupted global stocks.
Many place blame on the various hedge funds that rule the world with their machines.
The risk parity managers.
The trend followers.
The volatility targeting funds.
Truth is that nobody knows what caused it.
Interestingly the surprise is not the drop. As you’ll see below, such falls are common.
What was uncommon, was the extended period of extreme calm through 2017.
Yes, the press likes to ham it up.
And yes, the Dow Jones had the largest point drop in history on Monday.
But in real measures, percentages, it wasn’t a crash. Rather it was a regular downside blip.
In Australia, where the headlines spewed forth $58 billion of losses, the Monday decline was in fact the 45th worst since 1980.
In other words such a fall occurs on average more than once a year. And considering the last was back in mid-2016, then we were overdue for the regular drop anyway.
So where to now?
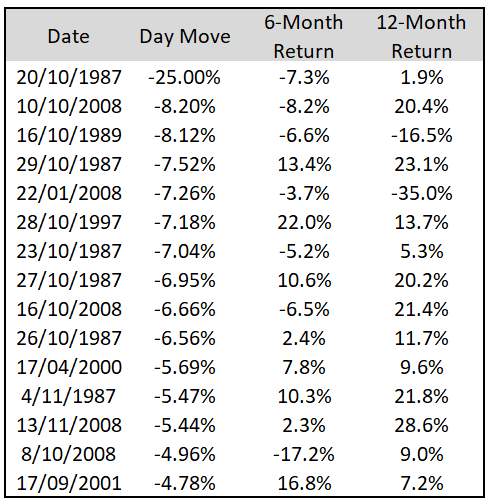
The following table shows the 15 worst one-day declines in the ASX since 1980.

You’ll notice the following 6-month return was underwhelming in most cases, higher 55% of the time with an average gain of 2.1%, the following 12-month return was much stronger.
We see 13 of 15 (85%) windows higher with an average gain of +9.5% (excluding dividends).
That’s about double the long term market average.
The other observation is the majority of large one-day declines are clustered during the 1987 crash and 2008 crisis. Only 18 of the largest 45 declines since 1980 occurred outside those extreme events.
In summary, large one-day declines tend to be followed by above average market performance in the following 12-month period.
Are you ready to take advantage of any upside movement? Join The Chartist and stay in touch with the latest market information.


