Forum Replies Created
-
AuthorPosts
-
ScottMcNab
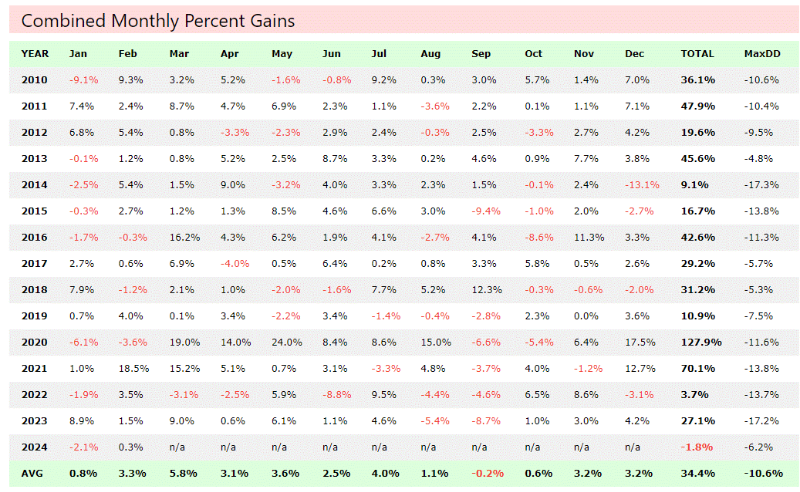
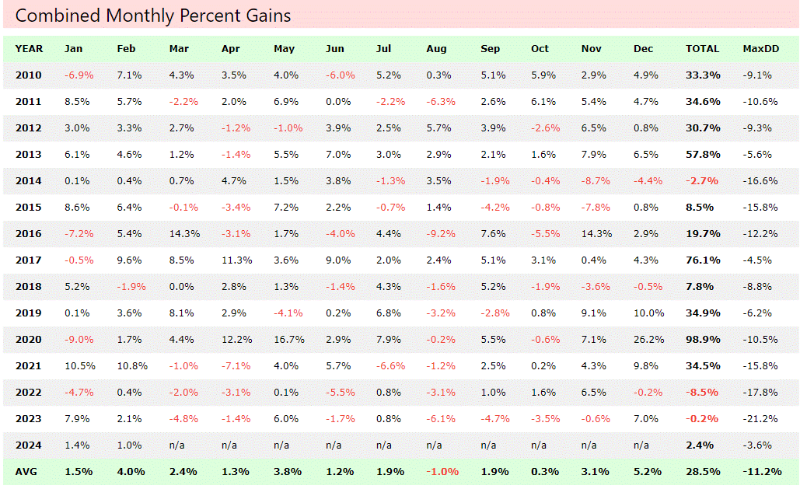
ParticipantAnother fun friday night on call as unpaid uber driver for the girls….so played around with back test results
I only have 3 distinct mrv type systems..in practice they are used either moc, mono or mrv (3-6) days with or without leverage and spread between RUI, RUA and USA (much as the same as many here do) but I was unsure how to test the systems against each other per se…. in the end just used all USA as universe and tested as a MRV system without leverage (10×10)…in reality some systems did not achieve these returns as results of the same system on RUI not as good as on USA…anyway…lets see if I can post pics in a readable format
sys1 was designed end of 2016 and traded live since 2017 in different forms (moc, mrv, mono)…I tried to add in the old code (to copy the amibroker delay if missed entry) but didn’t seem to work unless added legacymode:true….which then mucked up something else and I lost interest…so apologies that the results are without that original feature


ScottMcNab
ParticipantI think basic pattern was lost money in 2022 and recovered in 2023 but will look further….seeing all the OOS talk a while back on the RT forum I was tempted to post the results of a couple but there are a few individuals on that forum that can be a bit arrogant/abrasive ….my first ever system constructed at the completion of the Mentor Course was designed in 2016 and started trading in early 2017. It has had two changes in that time after I switched from Ami to RT. The first was to add an exit if stock tanked (doesn’t actually improve back test but seemed prudent after covid) and the second was allowing entry following day (v Ami default of waiting until exit signal to be eligible again)…i might back those changes out and compare them
ScottMcNab
ParticipantNot really happy with return of my etf systems so it back on hold
started live trading MRV system with small account after long layoff…TWS was so far out of date it refused to update and needed re-installation…updates on Chartist API smooth
will continue to monitor results v back-test to make sure I have not missed anything crucial regarding changes in RT code since I was last live….so just the one system at the moment and will endeavour to resurrect the other 5 I used to trade over the next month or two….or three..orScottMcNab
ParticipantVery impressive to have that conviction/fortitude
ScottMcNab
ParticipantI have not traded a long term system for many years Paul. Not purely for any philosophical reason…just the ones I came up with were not great and I couldn’t bring myself to stick with them. I have hedged my short term MRV systems with futures at times. I am paper trading a longish term ETF system but I selected aus domociled etf’s so I wouldn’t have to deal with the hedging issue (and the CHESS makes me feel better….which may or may not be true ?). I imagine if I was trading a long term US ETF system I would hedge it using futures with a basic filter similar to what Nick has discussed in the forum (assuming you have access to futures trading acct)
ScottMcNab
ParticipantVery interesting.. thank you. Great to get new ideas about where to go fishing
ScottMcNab
Participantboom…what did u decide re currency hedge Paul ?
ScottMcNab
ParticipantHi Julian.. these are his shorter term (eg rsi) strats on index etf ? He also had some 3-4 bar chart patterns (with names like blast off or something?) (for futures I think) that he published a book on…i tried testing these back in 2017 but didn’t have any joy…but I have always found the stuff he published with Cesar seemed to work fine
CheersScottMcNab
ParticipantNov2023 Index ETFs (paper trading) 3.9%
currently holding ijp, ivv, vgs and ndq
prob go live in Jan so the next month likely to also be good on paperScottMcNab
ParticipantStarted paper trading aus domiciled world etf TF system….which then immediately exited 2 of the 4 positions….off to the races
ScottMcNab
ParticipantThe graph of drawdown seems to show it has always been in single figures? If I have read that correctly then results seem impressive…especially as it would be live results through covid and Ukraine war supply shocks etc and not just a hindsight back test ….whenever i constrain volatility to keep DD low my cagr plumets and I am not yet quite at 33 billion
ScottMcNab
ParticipantThanks Nick…as much as it hurts I think 3-4 SD move is what I will go with at this stage….which directs me more towards the “ETF index camp” for a long term system than individual stocks
ScottMcNab
ParticipantJulian Cohen post=14186 userid=5314 wrote:I thinkVolatility: stddev(S.NetPct,20) * sqr (252)
I think that gives you 20 day annualised std dev
Hoping someone with better maths than me can help with my limited understanding of this metric please. I suspect I am misinterpreting it. The only statistics course I did was almost 30 years ago which puts me firmly into the “a little knowledge is dangerous” camp. If the distribution of returns was normal, then a 2 SD move would contain approx 95% of observations….but I believe that distributions of returns are not normally distributed and have fat tails such that a 3 (or even 4) SD move would not be unexpected. I am trying to use this metric 2 ways.
1. in backtesting of systems…eg… i have a long term trend following system with 15 cagr and -30% DD with 15% vola….i then change or optimise a metric and the DD drops to -24%….is this a real improvement of have I just curve fitted ? I find it so difficult to get a sufficient number of trades in one specific market that I don’t tend to reserve a small 5-10 year time frame for OOS as it doesn’t really provide a sufficient sample size. In the past I tried to answer this by taking it over to the AUS and TSX data sets and seeing if the change in the metric resulted in the same overall trend to backtest results. I have now also tried looking at the change in vola. If the improvement of DD from -30 to -24 resulted in no change to the vola (ie remained at 15% in this example) then I am less likely to think I have made a meaningful change than in the case where the lower DD was also accompanied by a drop in vola (eg to 12 or 13%)
2. deciding if a system is broken or needs to be shut down….along the same lines, using vola may be helpful in predicting future DD…rather than using the simple assumption that the system is broken if it reaches 2x the drawdown of the backtest (which is obviously only 1 or many possible outcomes), is it possible to extrapolate vola using a 3 or 4 SD move for a more meaningful estimate ?…so for a 3SD move it would be a case of doubling the vola and making it negative to get a likely future DD expectation….my concern is obviously that my lack of understanding regarding the distribution of the returns is leading to incorrect conclusions
Thanks
ScottMcNab
ParticipantStill on the sidelines…went to cash Feb 2022…boredom and FOMO led me trade July-Sep 2022 with about 5% of equity….missed carnage of 2022 but also missed out on rebound in 2023 so swings and roundabouts
Been playing around with ETF’s
ended up deciding on a model using Aus domiciled etf’s in hope of avoiding hedging currency risk…and also decided to limit myself to stock indices initially
as the USA makes approx half of world stock market I made 2 lists….one with Aussie plus other world markets and the second only USA Index etfs
I worry that this decision is curve fitting….the other possibility is to have a single list of all world index etfs and simply let the system pick
currently sticking with the 2 lists but would welcome feedback
each list (world ex-USA and USA) gets 50%
there are 18 etfs in world list and system picks 4
are only 4 in USA so system picks 2
no double upstesting from 2014 onwards I came up with quite a few systems that seemed ok but was unable to decide…as I am essentially just trend following an index I took the systems and ran them over SPY from its onset….that knocked a few contenders out with large drawdowns….results of best system were cagr 9 maxDD 18 vola 11
so I then applied them to stocks themselves (using same entry criteria as an index filter) and ran them back to 1995… was only really left with a single system
when I run this back over my 2 lists of etfs from 2014 onwards I get a cagr of a bit over 8 and a max DD of about 16 (with vola a bit over 10)
It seems a bit underwhelming to be honest
Perhaps the results are not unreasonable for a simple trend following system on stock indices
ScottMcNab
ParticipantI have spent an hour or so trying to process this but still struggle to comprehend fully what you went through Kate. Your strength and resilience are inspiring.
-
AuthorPosts

