Forum Replies Created
-
AuthorPosts
-
SaidBitar
ParticipantTuesday 2/2
Tested the system in Trading System Article Depository.
started coding a new system
watching football and coding don’t work together 😳SaidBitar
ParticipantI think the idea of this system is to buy when there is any huge gap up in the stock but the problem since 1.75 ATR is quite huge most of the time it is buying near the top and the close is lower. Unless the stock gaped up on super good news it will start going down to cover the gap, may be the opposite will be more profitable

SaidBitar
ParticipantI tested this system with the following parameters:
DMIPlus of 100 days needs to be less than/equal to DMIMinus of 20 days
Index Filter of duration 200 days
Buy when prices rise above yesterdays high by the average range of the last 14 days * 1.75exit after 1 day till 10 days from the buy
all of them are with not good results the system couldn’t achieve CAR above 3% while drawdowns can go as deep as 30%
universe Russell 1000
price limiters 1 – 100$
volume min of 500K
leverage 50%SaidBitar
ParticipantI calculated the correlation coef based on monthly return for the period from 1/1/1995 till 1/1/2016 for the two MRV systems and it is 0.69
SaidBitar
Participantthis is the monthly returns.
i was expecting to have high correlation between them.
SaidBitar
ParticipantTough question
i think the correlation is a bit high, since the same concept and same universe.
i have to test it
SaidBitar
ParticipantFriday 29/1 till Sunday 31/1
nothing special just re reading some of the modules
Ran MCs on two strategies
tried to improve one trend following strategyMonday 1/2
i ran backtest on Trend Following strategy and other MRV strategy and took the VAMI (profit table) from amibroker for each strategy and summed them together.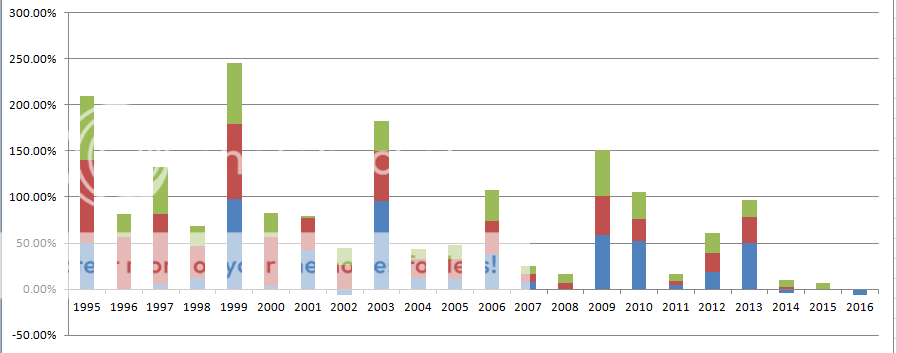
the blue is trend following and the others are MRV. when i saw how the multiple strategies compliment each other and improve the over all performance of trading I dumped the idea of seeking the best results by changing the entries and exits for the Trend following strategy.
Note for myself:
Time and following the system pays on the long run.
Hmmm time is an enemy and friend at the same time
SaidBitar
Participanthere is a snapshot of the system Before adding the lines to the code
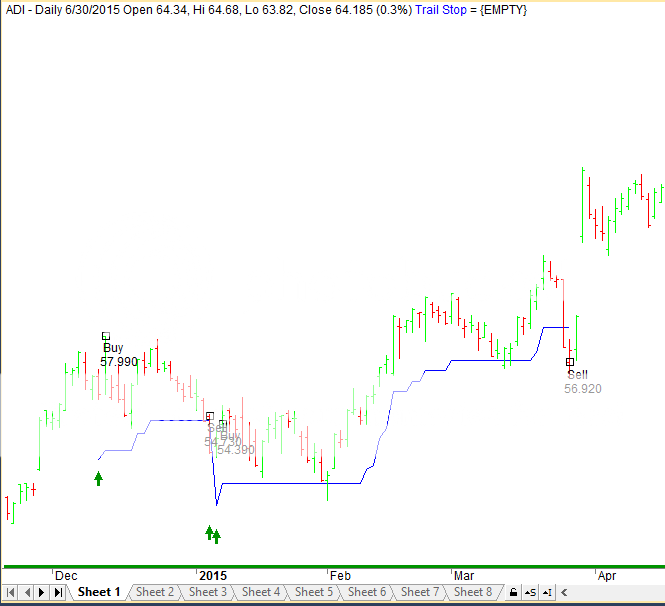
here how to looked after
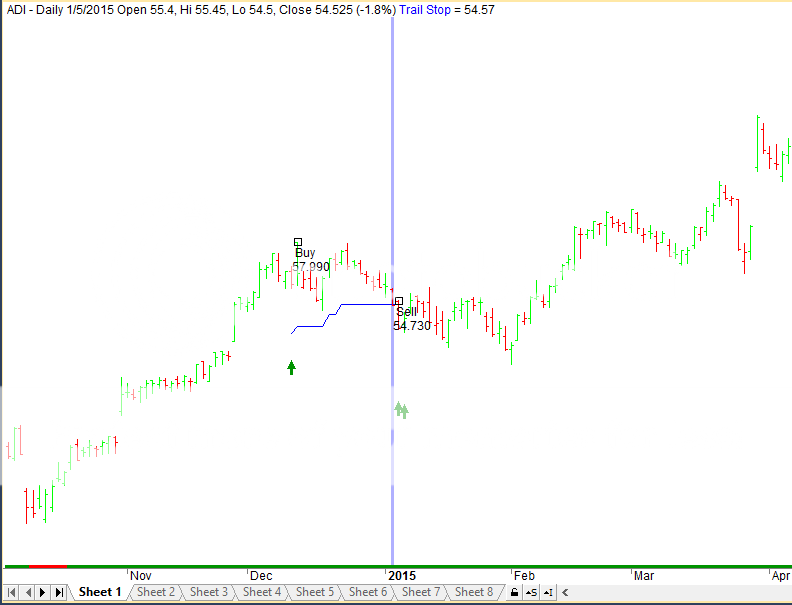
just a small note you see that the first trade was with loss but the second entry was profitable. Anyhow it is good to test to see if there is added value to it or no
SaidBitar
ParticipantHi
here is my solution , I tested it and it worked for me
Code:Buy = 0;
Sell = 0;
PriceAtBuy = 0;
LBIT = 0;
LStop = Null;
DaySinceSell = 0;//———————————————————————————
for (j = 1; j < BarCount; j++) { if(PriceAtBuy == 0 AND LE[j] AND DaySinceSell == 0) { Buy[j] = True; BuyPrice[j] = LEPrice[j]; PriceAtBuy = LEPrice[j]; LBIT[j] = 1; LStop[j] = Max(TrailStop[j-1], TrailStop[j]); LSTop[j-1] = TrailStop[j-1]; if(LBIT[j] > 1 AND (Close[j-1] <= LSTop[j-1] OR OnSecondLastBarOfDelistedSecurity[j])) { Sell[j] = True; SellPrice[j] = Open[j]; PriceAtBuy = 0; DaySinceSell = 1; } } else if(PriceAtBuy > 0)
{
LBIT[j] = LBIT[j-1] + 1;if(LBIT[j] > 1)
{
LStop[j] = Max(LStop[j-1], TrailStop[j]);
}if(LBIT[j] > 1 AND (Close[j-1] <= LSTop[j-1] OR OnSecondLastBarOfDelistedSecurity[j])) { Sell[j] = True; SellPrice[j] = Open[j]; PriceAtBuy = 0; DaySinceSell = 1; } } if(DaySinceSell > 0 AND DaySinceSell < 5 ) { DaySinceSell = DaySinceSell + 1; } if(DaySinceSell == 5) { DaySinceSell = 0; } }
the concept is as follows:
you create one counter to count how many days since you had sell signal “DaySinceSell ” the initial value will be zero
the moment you have sell signal you increment it to 1
then there is an if statement that will check if DaySinceSell >= 1 then it will increment it by one again
when the value will reach 5 then the if statement if(DaySinceSell == 5) will become true and the value of DaySinceSell will be set to zero
then this will be one of the conditions for the buySaidBitar
ParticipantNormally i go to the Info tab to see the results, I noticed that you can see it down
SaidBitar
ParticipantThursday 28/1
All theoretical part is done, till the end of the week i should re check some of them since some ideas are new and require some time to digest

Hopefully next week system developing will start, last module is so rich with ideas.
28/1 days run very fast and almost one months of 2016 and the only trading i did was closing some trades that hit the trailing stop just one survivor actually it is only moving in its place one day up next day down
SaidBitar
ParticipantI have to make more detailed testing to know exactly under what conditions the system was on and then start looking for ideas to fill the idle time.
the nice thing with the idea is that the same money will be used for two systems which is great but also i should test the results together to see the drawdowns and the other effects
SaidBitar
ParticipantWed 27/1
Finished Mod 26 lots of new information that needs lots of time to test. Over the weekend have to re read several modules again to digest their rich contents.
new idea that sounds very interesting :
“Exposure % – ‘Market exposure of the trading system calculated on bar by bar basis. Sum of bar exposures divided by number of bars. Single bar exposure is the value of open positions divided by portfolio equity. In layman terms exposure means how much time you’re invested in the market. Buy and hold would be 100 and 10 would mean you’re invested just 10% of the time. This can be beneficial to discern how much capital is being used with the strategy and therefore offers an insight on the ability of using the same capital to trade other strategies. “interesting stuff especially when there is a trading system with 35% exposure time.
SaidBitar
Participanthere is the second option
Code://Plot Fast Group
Plot(FEMA1, “nFast EMA 1”, FastGroupColor, FastGroupStyle);
Plot(FEMA2, “Fast EMA 2”, FastGroupColor, FastGroupStyle);
Plot(FEMA3, “Fast EMA 3”, FastGroupColor, FastGroupStyle);
Plot(FEMA4, “Fast EMA 4”, FastGroupColor, FastGroupStyle);
Plot(FEMA5, “Fast EMA 5”, FastGroupColor, FastGroupStyle);
Plot(FEMA6, “Fast EMA 6”, FastGroupColor, FastGroupStyle);//Plot Slow Group
Plot(SEMA1, “nSlow EMA 1”, SlowGroupColor, SlowGroupStyle);
Plot(SEMA2, “Slow EMA 2”, SlowGroupColor, SlowGroupStyle);
Plot(SEMA3, “Slow EMA 3”, SlowGroupColor, SlowGroupStyle);
Plot(SEMA4, “Slow EMA 4”, SlowGroupColor, SlowGroupStyle);
Plot(SEMA5, “Slow EMA 5”, SlowGroupColor, SlowGroupStyle);
Plot(SEMA6, “Slow EMA 6”, SlowGroupColor, SlowGroupStyle);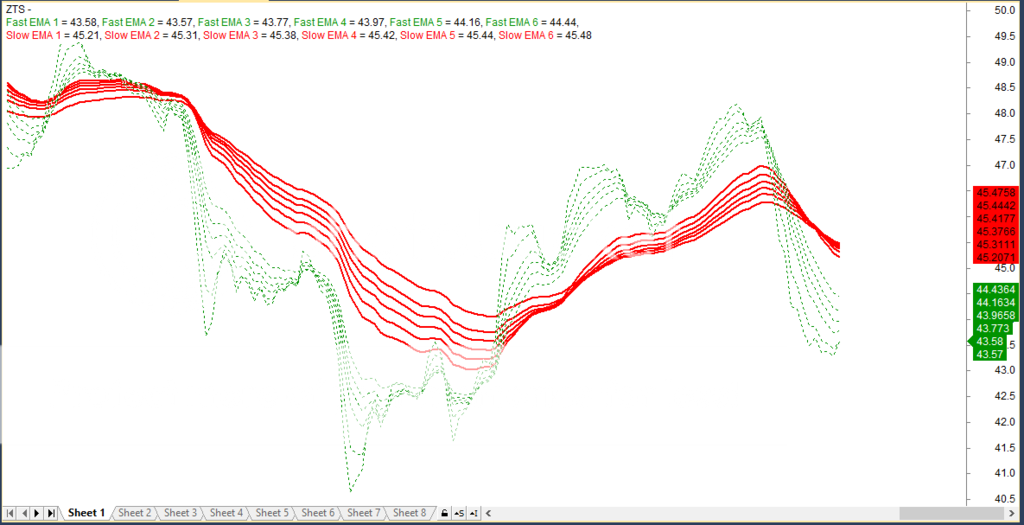
SaidBitar
Participantyou need to add n before the name of the Indicator in the plot function
each n means new line so if you want to put each on a new line you need to addn for each EMA like the code bellow if you want to put the fast group all of them on one new line and the slow group all on another new line you need to add n for the first plot of the fast group and the first plot in the slow group
like thisCode://Plot Fast Group
Plot(FEMA1, “nFast EMA 1”, FastGroupColor, FastGroupStyle);
Plot(FEMA2, “nFast EMA 2”, FastGroupColor, FastGroupStyle);
Plot(FEMA3, “nFast EMA 3”, FastGroupColor, FastGroupStyle);
Plot(FEMA4, “nFast EMA 4”, FastGroupColor, FastGroupStyle);
Plot(FEMA5, “nFast EMA 5”, FastGroupColor, FastGroupStyle);
Plot(FEMA6, “nFast EMA 6”, FastGroupColor, FastGroupStyle);//Plot Slow Group
Plot(SEMA1, “nSlow EMA 1”, SlowGroupColor, SlowGroupStyle);
Plot(SEMA2, “nSlow EMA 2”, SlowGroupColor, SlowGroupStyle);
Plot(SEMA3, “nSlow EMA 3”, SlowGroupColor, SlowGroupStyle);
Plot(SEMA4, “nSlow EMA 4”, SlowGroupColor, SlowGroupStyle);
Plot(SEMA5, “nSlow EMA 5”, SlowGroupColor, SlowGroupStyle);
Plot(SEMA6, “nSlow EMA 6”, SlowGroupColor, SlowGroupStyle);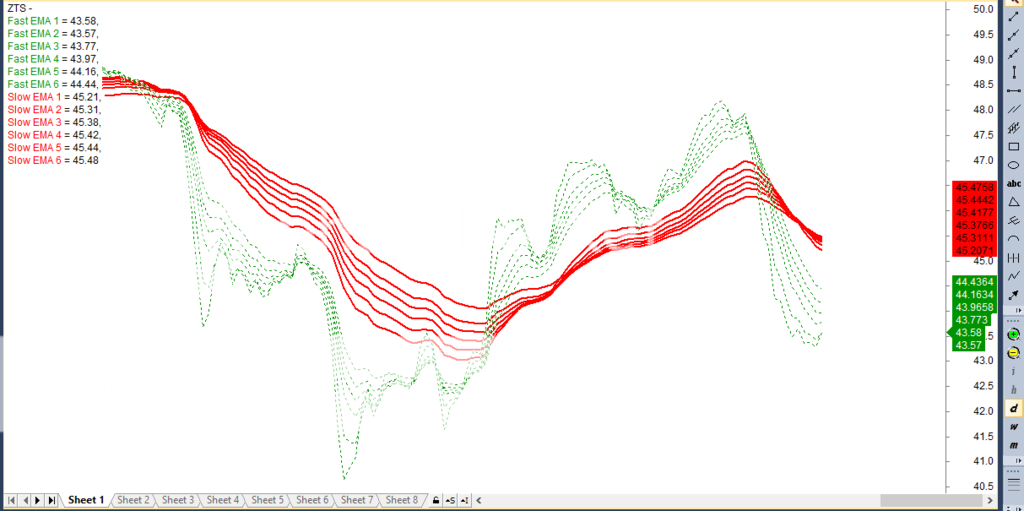
-
AuthorPosts