Forum Replies Created
-
AuthorPosts
-
KateMoloney
ParticipantSounds like you’ve been having a lot of fun Daniel.
Did you read Fridays Chartist newsletter? Very interesting seeing all the different results from changing filters and pos sizing.
KateMoloney
ParticipantThought for the day …
You can look for the secret sauce, the magic code or someone elses trigger rules ..
But if you want to succeed, the best way to do so is to find YOUR secret sauce to success.This starts with knowing yourself … your strategy, your goals, your risk tolerance, time you can commit etc, and then building a strategy around that.
I’ve come to see the system building part as a creative process, like an artist painting on canvas. Some days ideas flow, other days the systems I design are total crap.
As the research phase continues, you get to know and understand the strategy, and then a deeper level of understanding of self and the system comes from live trading.Investing the time into building a system from the ground up, whilst challenging at times, is also very rewarding. And I believe it to be far more sustainable than obtaining the “magic ingredient” from some guru. As much as some people would kill to get Craig or Nicks AB codes, I wonder how many people would trade those systems year in year out, because its not just the code that makes the trader, it is the trust in the research and during drawdowns that makes the trader ….
KateMoloney
ParticipantGlen, your a wizard! One day I hope to be half as smart as you …..
Dan, sounds like you’ve made a lot of progress. 40% different trades sounds like a decent difference from the initial code.
Keep us updated on your progress.Have you looked at liquidity filters as per Julian and Glen?
I’ve been looking at price filters, started with $30 – $1000. It produced a negative return, but trying other options as I type…..KateMoloney
ParticipantWelcome on board Chris.
The programming skills can be developed, just takes time and practice! It might seem daunting at first, but you are in good hands with Craig – he is an excellent teacher and very patient. Make sure you reach out to him as soon as you get stuck.
New Zealand is a very beautiful country. I grew up on the west coast in the Waitomo region.
KateMoloney
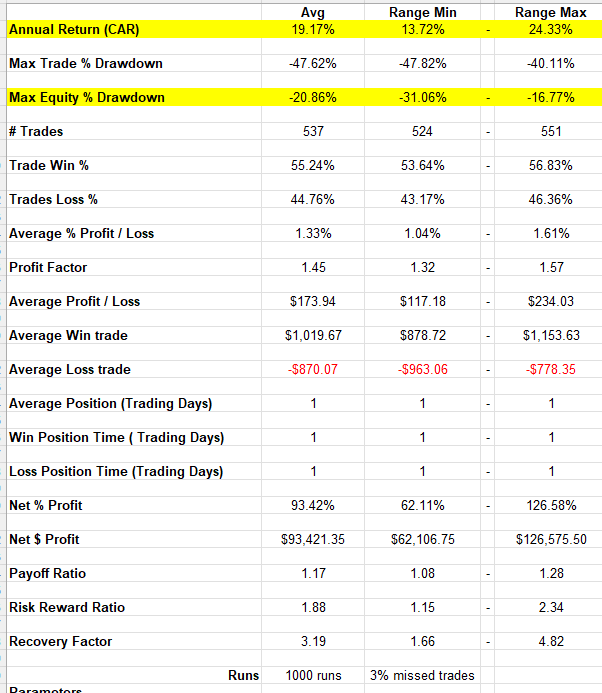
ParticipantMCS 3 year 2019 – 2022, 1000 runs skipping 3 % of trades.
Going to run MCS on other short term periods to see if there is as much variation, given the largest drawdown to the strategy was in 2020.Prior to June 2022, the MOC strategies produced very similar MCS results on short term VS long term.
Still wrapping head around weekly/monthly strategies, but takeaway so far is to expect short term results to vary from longer term CAGR / max DD figures. It should even out with the longer term implementation of the strategy.

KateMoloney
ParticipantTerry Dunne post=13443 userid=719 wrote:Streuth, nice stats Nick/Kate!Nick and the team did a great job with this strategy.
Might be something for you Terry ….KateMoloney
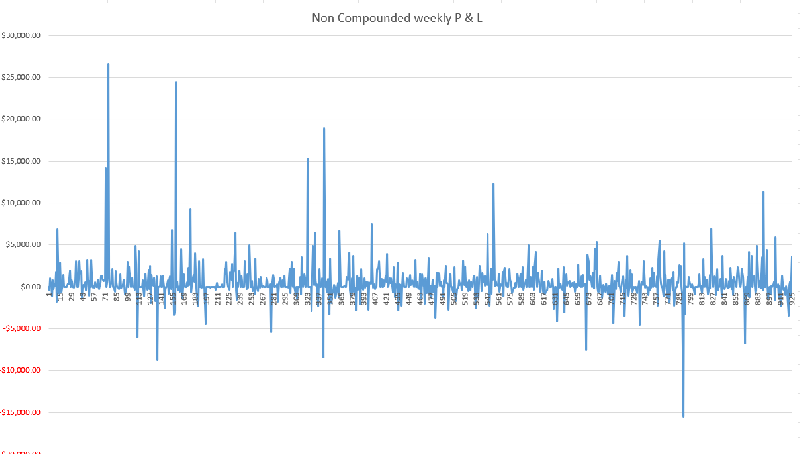
ParticipantWeekly Non Compounded P & L
Original code with a slightly higher stretch
50% margin 2005 – 2022

KateMoloney
ParticipantAlso, all my tests so far are on 50% margin.
Used IB comms in settings 0.08% and $6 per trade min.
Test without dividends.
KateMoloney
ParticipantJulian Cohen post=13438 userid=5314 wrote:I have bought it Kate. I must admit I didn’t even consider changing the ranking…off I go then
Happy to swap notes if you want to email me
Sent you an email Julian.
I found ranking to be the best change. Surprised you didn’t think of this given I’m the rookie

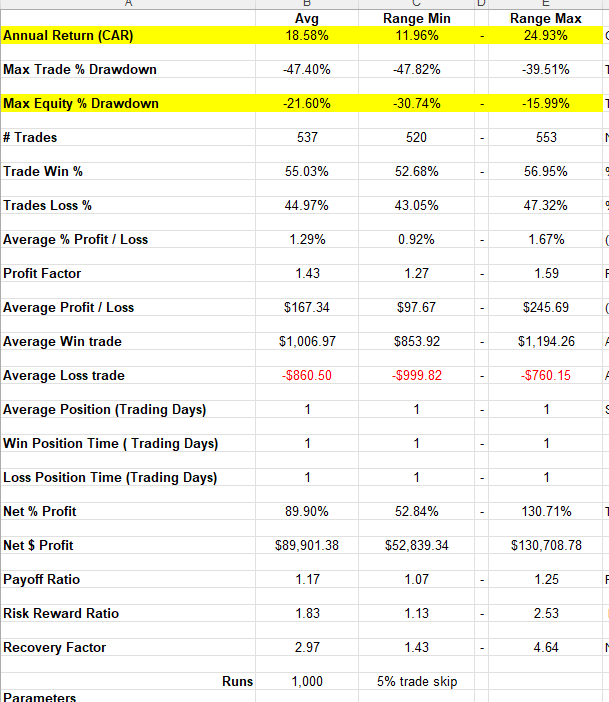
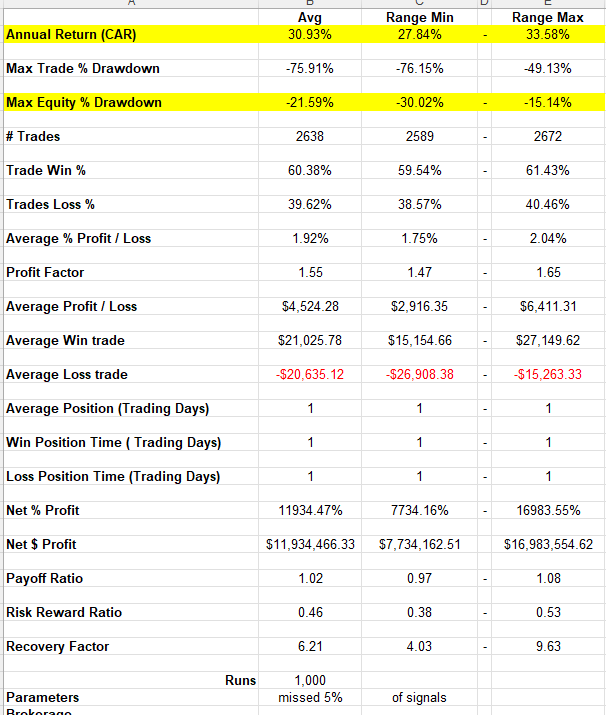
Run MCS on the system 2019 – 2022, and 2005 – 2022.
1,000 runs skipping 5% of trades.Short term there is a larger variation in results … currently investigating this …
Below is MCS for original code
MCS 2019 – 2022

MCS 2005 – 2022

KateMoloney
ParticipantExert from book…..
“We’ll use annualized exponential regression slope, calculated on the past 90 days, and then multiply it with the coefficient of determination (R2) for the same period. This gives us a volatility adjusted momentum measurement. Remember that if a stock is trading below its 100 day moving average or has a recent gap in excess of 15%, it’s disqualified.
Calculate position sizes, based on 10 basis points. Calculate position size, using a simple ATR based formula, targeting a daily move of 10 basis points. The formula to calculate number of shares is AccountValue * 0.001 / ATR20. Check index filter. You’re only allowed to open new positions if the S& P 500 Index is above its 200 day moving average. If it’s below, no new buys are allowed.
Construct the initial portfolio. Start from the top of your ranking list. If the first stock is not disqualified by being below its 100 day moving average or having a 15% + gap, then buy it and move to the next. Buy from the top until you run out of cash. Rebalance portfolio every Wednesday.
Once a week we check if any stock needs to be sold. If a stock is no longer in the top 20% of the S& P 500 stocks, based on the ranking, we sell it. If it’s trading below its 100 day moving average, we sell it. If it had a gap over 15%, we sell it. If it left the index, we sell it.”
— Stocks on the Move: Beating the Market with Hedge Fund Momentum Strategies by Andreas Clenow
https://amzn.asia/7A6NcLfKateMoloney
ParticipantUpdate:
Tried testing dual ROC/dual ATR. Performance of system boosted by one stock in 2013 that profited 800% plus.
May end up scrapping the idea.The stocks on the move book has been useful, even just for ideas to test and tweak.
Will continue documenting and adding research notes to this thread.
“Perhaps if we measure the distance between the 50 day moving average and the 100 day moving average. By doing that, we’ll have a quantifiable measure of the momentum. We could even make it simpler, and just measure the distance between the price and a moving average. Now compare the percentage distances for a large group of stocks, and you’ve got a rudimentary ranking method. It’s not a great ranking method, but it’s a decent start.”— Stocks on the Move: Beating the Market with Hedge Fund Momentum Strategies by Andreas Clenow
https://amzn.asia/967UI90KateMoloney
Participantwhoops!
Just have to do that for a good day next time

KateMoloney
ParticipantASX
Growth defensive – cash
ASX Momo +4.92%US
US Momo – cash
TLT -2.58%
Day trade # 1 -8.87%
Day trade # 2 -8.94%Still reviewing day trade and determining re-entry plan.
Studying for new momentum strategy and bought ASX swing strategy to add to the mix.
Enjoying the challenge of expanding my systems.
KateMoloney
ParticipantNice work Terry
September 28, 2022 at 1:58 am in reply to: Dealing with Current Drawdowns in MOC / Mean Reversion Systems #115064KateMoloney
ParticipantRob M post=13395 userid=5369 wrote:I don’t see the article link.Click on his text, “here is an article” there is link
-
AuthorPosts