Home › Forums › Trading System Mentor Course Community › Progress Journal › Trents Weekly Journal
- This topic is empty.
-
AuthorPosts
-
April 29, 2020 at 12:06 am #111291
ScottMcNab
ParticipantTrent Rothall wrote:Has anyone traded using or studied Wyckoff principles either discretionary or systematically? If so does anyone have any code?Or VPA analysis?
Not sure if this of interest Trent?
https://www.elitetrader.com/et/threads/wyckoffian-intra-day-traders-asia-rth.344023/
April 29, 2020 at 2:07 pm #111358Anonymous
InactiveHey Trent – I came here to ask what universe you are trading your MOC systems on the ASX.
But I saw mention of VPA, and I have not much to offer regarding VPA but I do use a VWAP strategy on Bitcoin that has served me well. I have not yet tried to apply this to equities (well, apart from where Nick pegged me down for not understanding what I was doing, which was correct), but I do think there is something here. The answer may be “not with EOD data on stocks”, but it doesn’t hurt to get my thoughts in a line. I’ll show examples of it as well.
This will help me to congeal my ideas:
Code:“VWAP per Tradingview Calculation”
Calculate the Typical Price for the period.[(High + Low + Close)/3)]
Multiply the Typical Price by the period Volume.
(Typical Price x Volume)
Create a Cumulative Total of Typical Price.
Cumulative(Typical Price x Volume)
Create a Cumulative Total of Volume.
Cumulative(Volume)
Divide the Cumulative Totals.
VWAP = Cumulative(Typical Price x Volume) / Cumulative(Volume)
For EOD data I surmised that you could come up with a ghetto-VWAP by dividing Turnover (Aux1) by Volume, and then creating a moving average based on that. The issue is that it doesn’t really offer anything more than a standard moving average, and VWAP has a time variant to it (restarts every day or week etc). So, that’s about the end of it for the EOD data. However, here is how I apply that in real time:
1

2

3

Yellow is the ENDING VWAP from the previous week. It is always a horizontal line.
Orange is the forming VWAP for the current week.I use a no-agreeance signal so that when price is between those lines, I will go long or short.
When price is above or below, well, you get the picture. Entries are based on Ehler’s Fisher Transform, which converts price over the previous N periods to a Gaussian (normal) distribution between -1 and +1. When prices are at extreme levels, the indicator crosses signaling an entry.I had been trading the Fisher Transform with no filter. You can see from the screenshots that it is quite prone to whipsaw – but it would be much worse without the VWAP. Overall it has helped to reduce losers by about 5%, bringing the win rate to 40-45% depending on the time frame. Commissions are low low low low on BTC, so there is not much drag. Overall, I do think that the strategy works better than random chance, however I do not know how to apply it to anything else. I have some Fisher Transform code in AFL if anyone is interested.
Shoot – now what was I working on before I started this essay…? Maybe I should reheat my coffee.
April 29, 2020 at 2:17 pm #111359Anonymous
InactiveWow, I was having a tough time getting those attachments to post.
May 1, 2020 at 2:05 am #111360TrentRothall
ParticipantHi Seth,
Do you get stopped out a lot on btc? there’s some wild volatility there! Are you trading it via cfds or another way?
Sounds confusing haha.On my MR system it isn’t a MOC just regular MR. I was trading on the All ords but now on the entire ASX will be monitoring slippage though.
May 1, 2020 at 7:22 am #111381TrentRothall
ParticipantInteresting docco
May 5, 2020 at 3:55 pm #111382Anonymous
InactiveTrent Rothall wrote:Hi Seth,
Do you get stopped out a lot on btc? there’s some wild volatility there! Are you trading it via cfds or another way?
Sounds confusing haha.On my MR system it isn’t a MOC just regular MR. I was trading on the All ords but now on the entire ASX will be monitoring slippage though.
I get stopped out all of the time. All of the freaking time. SO MANY TIMES! Not CFDs, just perpetual futures and expiry futures. Both of my current exchanges trade inverse futures contracts, so they settle in BTC instead of USD.
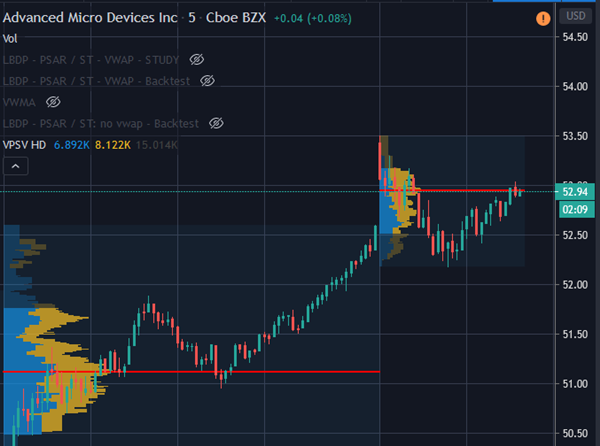
At any rate, if you like visualizing, this is another VPA style using visible bars that you may find useful (using 5min data):

or a visible range (daily):

I’ll have grab ASX data and get to plugging. Thanks for the info. If you want to spitball anything about volume then give me a shout. I think there is potential – but like I said, maybe better suited for intra-day and/or with futures.
Cheers
S
May 6, 2020 at 7:18 am #111399TrentRothall
ParticipantCheers seth looks good.
I spent the arvo adding custom metrics to my backtest report, it will be good for reviewing my entries instead of manually doing it in excel
May 27, 2020 at 6:31 am #111403TrentRothall
ParticipantCurrently testing a tweaked WTT as a lot of people are. I’m using some different filters for stock selection.
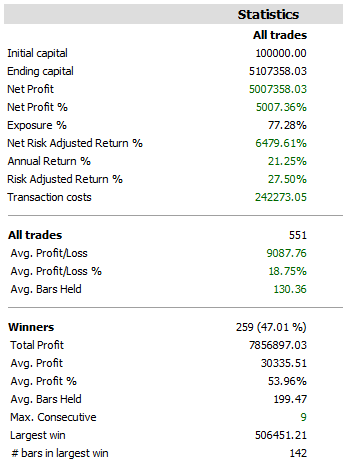
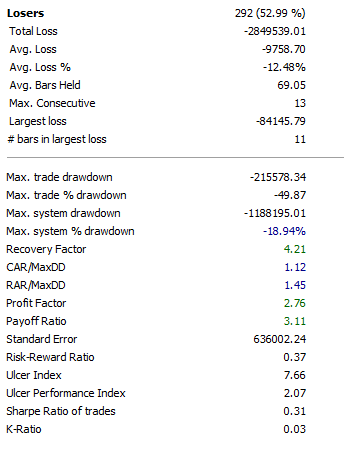
Results are currently looking suspicious (hopefully not) but can’t seem to fault it. What mistakes have others stumbled on that i should check?
May 27, 2020 at 9:02 am #111505GlenPeake
ParticipantThose stats look awesome!!!! Wish mine looked that good!!! Nice work…!
Whatever you’re doing with the tweaking appears to be working…..
Is that backtested on the ASX? Over what year period? Dividends enabled/disabled?
I know 1999 was a great year for my WTT in the backtest report….i.e. over 100% gain for the year… so if you include that in the backtesting, then it really sets you up for some pretty awesome looking numbers from that point on… so maybe exclude that year (or your best year) and backtest around it just to see what the stats look like around it etc… e.g. if I backtest from 1/1/1997 – 31/12/2010 I get CAR 31% MDD -19%….. which is pretty awesome.
In contrast, how do the bactests look for the last 5 years / COVID period?
In terms of double checks etc…. if you haven’t already done so, I’d double check the trade list and have a look at the biggest % Profit and biggest $$ Profit trades and double check the charts to ensure they are legit/tradeable and not BS etc…..e.g. a trade in MBN-201508.au (2014 – Spike), can sometimes sneak into the bactest and really ‘juice’ up the numbers.
In comparison, I’m almost embarrassed but here are my humble stats on the ASX since 1/1/2000 – present…excluding DIVs…:blush:

 May 27, 2020 at 9:49 am #111506
TrentRothall
ParticipantI should’ve stated the date etc sorry.
Last one was 05-1/1/2020
This is from 2005-now
20 x5 positons
universe is the entire asx
$0.1-$10 price filter
This one is excluding divs – last one included
Turn over us the same as your post in the other thread i think.Weird, when i include divs the CAR drops?
May 27, 2020 at 10:49 pm #111507TimothyStrickland
MemberNice Trent,
Are you running it like a momentum system? I am just now starting to build my WTT but want to run it similar to my momentum system on a weekly basis to reduce signal luck as per some of the conversations floating around the forums. I missed this week’s Mentor call unfortunately, was trying to attend it but just didn’t work out.
May 27, 2020 at 11:35 pm #111509TimothyStrickland
MemberNevermind, looking through the AFL documentation it doesn’t seem that there is any support for a weekly rotational system so I’ll have to build it differently.
May 28, 2020 at 12:15 am #111510Nick Radge
KeymasterTim,
The WTT is an absolute trend following strategy that uses weekly data.You can run a rotational momentum strategy on a weekly basis using
DofW = dayofweek() < Ref(dayofweek(),-1);
PositionScore = IIf(Year()>=1985 AND DofW,score,scoreNoRotate);May 28, 2020 at 1:24 am #111511TrentRothall
ParticipantAs Nick said Tim it is a trend following strategy, I have two different exits in mine but the basic system just uses a trailing stop to exit positions.
I also included the lower priced stocks in my testing so that would probably help the results in the back test. The size of the portfolio I’m planning on running is not very large and 20 positions means that position size is quite small. So I’m not too worried about liquidity.
May 28, 2020 at 3:00 am #111512TrentRothall
ParticipantHere’s the Profit table Glen.
I’m still suspicious…
-
AuthorPosts
- You must be logged in to reply to this topic.