Home › Forums › Trading System Mentor Course Community › Trading System Brainstorming › Trading System Article Depository
- This topic is empty.
-
AuthorPosts
-
May 26, 2016 at 6:41 pm #104083
SaidBitar
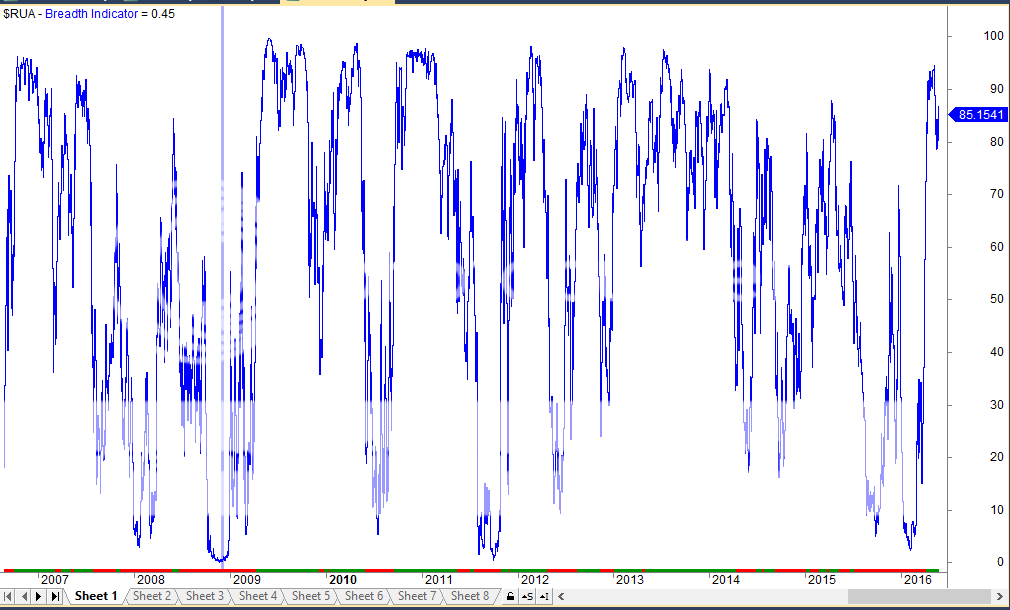
MemberJulian Cohen wrote:I haven’t had a chance to test this yet but it could be worth looking at as a different Index Filteri think this will be the code for it
Code:_SECTION_BEGIN(“Historical Database Testing”);
//=================================================================================================
//Historical database testing
//=================================================================================================
ASXList = ParamList(“ASX Historical Watchlist:”,”1: Off|2: ASX 20|3: ASX 50|4: ASX 100|5: ASX 200|6: ASX 300|7: ASX All Ordinaries|8: ASX Small Ordinaries|9: ASX Emerging Companies|10: Excluding ASX 300″,0);if(ASXList == “1: Off”) HistDB = 1;
if(ASXList == “2: ASX 20”) HistDB = IsIndexConstituent(“$XTL”);
if(ASXList == “3: ASX 50”) HistDB = IsIndexConstituent(“$XFL”);
if(ASXList == “4: ASX 100”) HistDB = IsIndexConstituent(“$XTO”);
if(ASXList == “5: ASX 200”) HistDB = IsIndexConstituent(“$XJO”);
if(ASXList == “6: ASX 300”) HistDB = IsIndexConstituent(“$XKO”);
if(ASXList == “7: ASX All Ordinaries”) HistDB = IsIndexConstituent(“$XAO”);
if(ASXList == “8: ASX Small Ordinaries”) HistDB = IsIndexConstituent(“$XSO”);
if(ASXList == “9: ASX Emerging Companies”) HistDB = IsIndexConstituent(“$XEC”);
if(ASXList == “10: Excluding ASX 300”) HistDB = IsIndexConstituent(“$XKO”)==0;//————————————————————————————————-
USList = ParamList(“US Historical Watchlist:”,”1: Off|2: Russell 1000|3: Russell 2000|4: Russell 3000|5: NASDAQ 100|6: Dow Jones Industrial Average|7: S&P 500|8: S&P 100|9: S&P MidCap 400|10: S&P SmallCap 600|11: S&P 1500|12: Russell MicroCap|13: Russell MidCap”,1);if(USList == “1: Off”) USHistDB = 1;
if(USList == “2: Russell 1000”) USHistDB = IsIndexConstituent(“$RUI”);
if(USList == “3: Russell 2000”) USHistDB = IsIndexConstituent(“$RUT”);
if(USList == “4: Russell 3000”) USHistDB = IsIndexConstituent(“$RUA”);
if(USList == “5: NASDAQ 100”) USHistDB = IsIndexConstituent(“$NDX”);
if(USList == “6: Dow Jones Industrial Average”) USHistDB = IsIndexConstituent(“$DJI”);
if(USList == “7: S&P 500”) USHistDB = IsIndexConstituent(“$SPX”);
if(USList == “8: S&P 100”) USHistDB = IsIndexConstituent(“$OEX”);
if(USList == “9: S&P MidCap 400”) USHistDB = IsIndexConstituent(“$MID”);
if(USList == “10: S&P SmallCap 600”) USHistDB = IsIndexConstituent(“$SML”);
if(USList == “11: S&P 1500”) USHistDB = IsIndexConstituent(“$SP1500”);
if(USList == “12: Russell MicroCap”) USHistDB = IsIndexConstituent(“$RUMIC”);
if(USList == “13: Russell MidCap”) USHistDB = IsIndexConstituent(“$RMC”);//————————————————————————————————-
HDBFilter = HistDB AND USHistDB;//=================================================================================================
_SECTION_END();
period = Param(“Look Back Period”,60,1,500,1);
UP30 = ROC(C,period) >= 30 AND HDBFilter;
DN30 = ROC(C,period) <= -30 AND HDBFilter; //BI = IIf(UP30,IIf(DN30,UP30/(UP30+DN30)*100,1),0); Buy = 0; Filter = 0; AddToComposite(UP30,"~~UP30","X",atcFlagDefaults ); AddToComposite(DN30,"~~DN30","X",atcFlagDefaults ); //Plot(Foreign("~~UP30","C"),"UP30",colorBlue,styleLine); //Plot(Foreign("~~DN30","C"),"DN30",colorBlue,styleLine); BI = Foreign("~~UP30","C")/(Foreign("~~UP30","C")+Foreign("~~DN30","C")) * 100; Plot(BI,"Breadth Indicator",colorBlue,styleLine); IndexFilter = Sum(BI > 75,10);
RibbonColour = IIf(IndexFilter,colorGreen,colorRed);
Plot(1,””,RibbonColour,styleArea|styleOwnScale|styleNoLabel,-0.0001,190);
what you need to do is select the filter and the lookback duration and run SCAN
this will create two tickers in the database one for the number of stocks that went up more than 30% (UP30) and the other for the number of stocks that went down by < -30% (DN30) then you can plot itMay 26, 2016 at 7:57 pm #104084JulianCohen
ParticipantThat was fast :cheer:
I’ll have a go at it in the next couple of days. I was going to look at using it as an index filter instead of the 200 day average on SPY to compare the differences.
June 1, 2016 at 12:30 am #102481LeeDanello
ParticipantTASC Traders Tips.
I’m not sure if this is by design or default but you can access all the strategies by copying and pasting the link and changing the year and month.
Most strategies work but they all have horrendous drawdowns
http://traders.com/Documentation/FEEDbk_docs/2016/06/TradersTips.html#item4.
Has worked for a few years.
I use it as an Amibroker learning tool.
June 21, 2016 at 5:55 am #102482LeeDanello
ParticipantI can’t remember where I found this, but could be useful albeit a little late
July 18, 2016 at 1:55 am #104392TrentRothall
ParticipantJust come across this link (don’t think it’s on here yet), think there is almost 1000 trading books on there. Quality seems to be lacking in some but haven’t really looked too hard.
EnjoyJuly 30, 2016 at 6:14 am #102483LeeDanello
ParticipantThis is a great free screen capture program. Spyware free
January 12, 2017 at 1:40 am #102484JulianCohen
Participanthttp://awealthofcommonsense.com/2017/01/10-things-you-cant-learn-from-a-backtest/
I enjoy reading this blog.
January 16, 2017 at 3:10 am #106049TrentRothall
ParticipantIt seems even the big funds have issues with overriding their wizbang multimillion dollar systems
January 20, 2017 at 7:20 am #102485JulianCohen
ParticipantWhat could possibly go wrong?
January 20, 2017 at 2:50 pm #106063LeeDanello
ParticipantJulian Cohen wrote:What could possibly go wrong?Can you loan me some money?
January 20, 2017 at 11:46 pm #106070TrentRothall
Participant$250 into $1.47m in 92 days… Isn’t quite up to my standards.
Next..
February 7, 2017 at 9:59 pm #102486LeeDanello
ParticipantThe following book from Art Collins discusses many MOC strategies that could be adapted to short term systems. Lots of ideas to explore in here. Even if they don’t work too great now they might spark an ah ha moment. Found this thru “Better System Traders”
Beating the Financial Futures Market: Combining Small Biases Into Powerful Money Making Strategies
March 20, 2017 at 2:24 am #106186Nick Radge
KeymasterTrading The Correlation Strategy.
Might be interesting for stocks as well as ETFs
April 9, 2017 at 10:29 pm #106405Nick Radge
KeymasterTest
April 18, 2017 at 6:20 am #102487JulianCohen
ParticipantThis podcast should probably be compulsory listening
http://www.toptradersunplugged.com/top-traders-round-table-dennis-proctor-parker-07/
-
AuthorPosts
- You must be logged in to reply to this topic.