Forums › Trading System Mentor Course Community › Running Your Trading Business › The Dangers of Using a Proxy
- This topic is empty.
-
AuthorPosts
-
March 12, 2016 at 11:23 pm #101453
Nick Radge
KeymasterProxy
Definition: To use or substitute for another
The world of ETF trading is expanding very quickly. It’s been a huge growth industry in the US for a number of years and in more recent times this explosive trend has moved into the Australian space. ETF’s are designed to mirror or ‘track’ certain instruments or portfolios of instruments.
There are two obvious drawback with ETFs;
(1) Liquidity
(2) HistoryI have come across many attempting to deal with (2) using a Proxy which has a longer history than that of the ETF itself.
This makes inherent sense, but can lead to another unknown problem that is usually overlooked.
Example:
When history in the actual ETF is lacking, a budding systems trader will test the system on the underlying index and then live trade on the new ETF and expect parallel results.
The largest ETF in the US is the SPDR S&P 500 (SPY) which tracks the cash S&P 500 index ($SPX). and whilst this ETF has been listed since 1993 it serves as a good example nonetheless.
Let’s use an example that was recently thrown across the social media universe with the title,”The Three Billion Dollar Day Trading System Revealed and Tested“
Now as we’ve all been versed in those red flag trading system you should not be surprised that there is something badly wrong with a system that apparently produces a 60% CAGR with a maxDD of 4%.
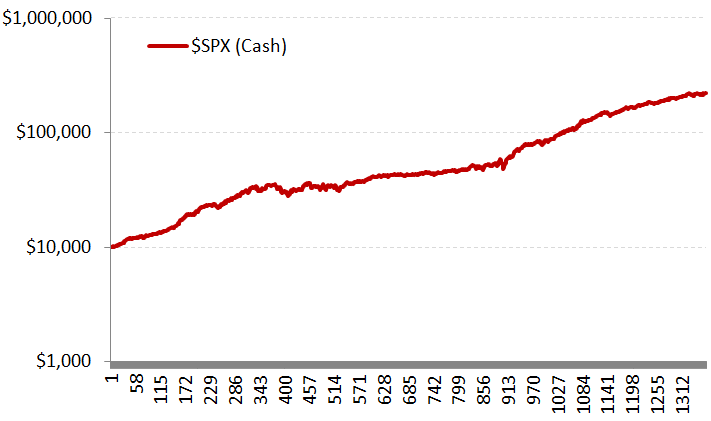
Let’s run the system on the S&P 500 ($SPX) cash index back to 1995. This equity growth chart assumes a start balance of $10,000 and all funds 100% reinvested into each new trade. This chart is log scale.

Metrics:
Total Return: 2115%
CAGR: 15.74%
Win% 59.7%
maxDD: -20.53%Not too shabby for a very simple system.
But what is wrong exactly?
The problem is mentioned in the 3rd paragraph, specifically, “…we look at the S&P 500 as the tradable, and how this day trading pattern reacts to it and has performed over the last 50 years...”
The S&P 500 is a cash index . It is NOT tradable so it is therefore being used as a proxy and is alluding to the possibility that you can replicate these results using the S&P 500 ETF. This is what most people would do, i.e. use the $XAO cash as a proxy to trade the SPI futures and an example.
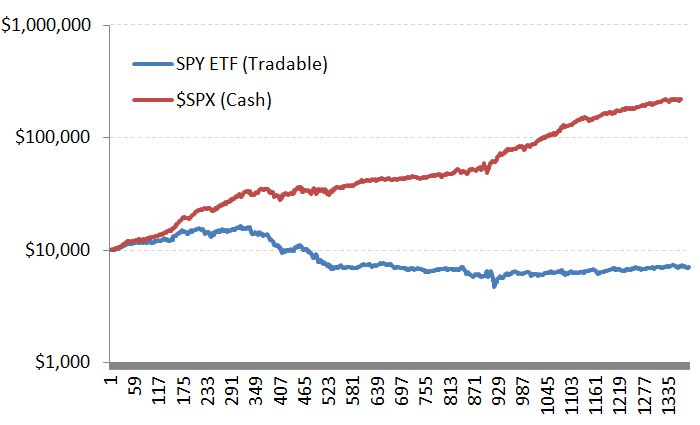
So, let’s take the system and actually test it on the tradable itself, the S&P 500 ETF (SPY). Here we plot the new equity curve against he proxy, log scale.

Metrics:
Total Return: -28%
CAGR: -1.6%
Win% 51.8%
maxDD: -71.4%Seem’s a very different picture…
If we go ahead and use our ‘rule of thumb’ of robustness, specifically, the strategy should work reasonably well across a large number of symbols, we fund that this setup rarely shows a profit on ANY listed security.
Here’s some basic code:
Code:SetTradeDelays(0,1,0,0);Cond1 = ATR(1) < ATR(7); Buy = Ref(Cond1,-1) AND H > Ref(H,-1);
BuyPrice = Max(Ref(H,-1)+0.01,O);Sell = Buy;
//Sell = ExRem(Sell,Buy);
SellPrice = Close;SetChartOptions(0,chartShowArrows|chartShowDates);
_N(Title = StrFormat(“{{NAME}} – {{INTERVAL}} {{DATE}} Open %g, Hi %g, Lo %g, Close %g (%.1f%%) {{VALUES}}”, O, H, L, C, SelectedValue( ROC( C, 1 ) ) ));Plot(Close,””,colorWhite,styleBar);
PlotShapes(shapeHollowUpArrow*Cond1,colorGreen,0,L,-80);
PlotShapes(shapeHollowSmallSquare*Buy,colorGreen,0,BuyPrice,0);
PlotShapes(shapeHollowSmallSquare*Sell,colorred,0,SellPrice,0);March 13, 2016 at 7:06 pm #102994SaidBitar
MemberThanks Nick for the valuable information, honestly i did not know that the index is not tradable.
But if the index is not tradable how when people talk about buy and hold they use the index which is not possible to buy.
the other thing the $SPX is not tradable but the SPY is, in theory the SPY should be a mirror of the $SPX but since it is tradable then all the time there will be difference between them. The price of the index is dependent on the price of the stocks that makes it while the price of the SPY depends on the traders trading it but when i put them together they are almost parallel and identical percentage wise. doesn’t make much sense.
most probably i am thinking too much.March 13, 2016 at 9:03 pm #102995Nick Radge
KeymasterQuote:But if the index is not tradable how when people talk about buy and hold they use the index which is not possible to buy.Correct, which is why the ‘traditional’ thinking is not necessarily the best way to think.
Quote:the other thing the $SPX is not tradable but the SPY is, in theory the SPY should be a mirror of the $SPX but since it is tradable then all the time there will be difference between them. The price of the index is dependent on the price of the stocks that makes it while the price of the SPY depends on the traders trading it but when i put them together they are almost parallel and identical percentage wise. doesn’t make much sense.
most probably i am thinking too much.The two do mirror each other but there is still slight tracking errors which influence the short term factors more than the longer term factors which you’re looking at. The system is very short term in nature and will have different open gaps and daily ranges and when these are taken into account on a micro level then you get the larger differences over the longer term.
Take Friday’s price action as an example:
Close of $SPX was +1.9%
Close of SPY was +1.6%Open Gap of $SPX was +0.258%
Open Gap of SPY was +0.861%Days range as % of prior close for $SPX was +1.39%
Days range as % of prior close for SPY was +1.63%These are micro details but impact on micro time frame strategies.
-
AuthorPosts
- You must be logged in to reply to this topic.