Forums › Trading System Mentor Course Community › Running Your Trading Business › System Stress testing Reporting
- This topic is empty.
-
AuthorPosts
-
April 24, 2016 at 7:02 pm #101479
SaidBitar
ParticipantIf there is one thing that i hate is making reports, and i believe this was the main reason to learn excel Macros due to the large number of reports that i have to do at my work.
Since trading should be treated as a business then reporting should not be ignored. I noticed this problem after making many strategies and running many MCs on them and saving them in excel after some time things are getting messy.
So I decided to make powerpoint presentation as a start and later word document for each strategy where I will have the system specifics and the results of MCs and stress testing.
I made the excel file that is attached bellow it will collect the results from Amibroker and generate presentation for the strategy under test. The file is still in the first stage so may be there are some errors in it.
I am using MS Office 2007 and did not have time to make the modifications so that it will work on any version of MS office, but i will tell you how to do it in case you have different versions.
so here we go
first part is

[ul]
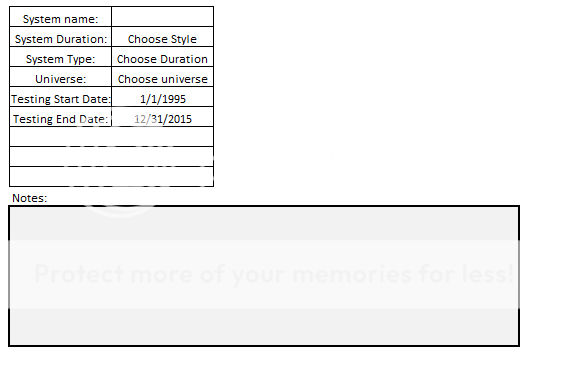
[li]system name is the place to write the strategy name and the version if you want[/li]
[li]System Duration is a drop down menu to choose the type of the system duration daily/weekly/Monthly[/li]
[li]System Type is a drop down menu to choose the system type MRV/Trend following/Momentum[/li]
[li]Universe is a drop down menu to select the universe that the test was performed on[/li]
[li]Test Start date is the start date of the simulations[/li]
[li]Test End Date is the end date of the simulations[/li]
[li]Notes is area where the system description can be written or whatever you want[/li][/ul]

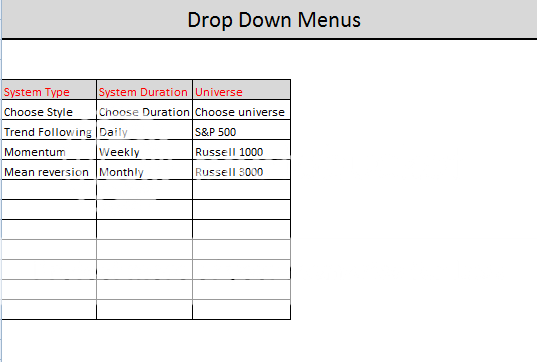
this is the area where the data in the drop down menus are found so if different data are required it can be added there
this is the process for running this macro, every shape with text it has code behind it to run so they should be run in the same sequence
Clear Settings it will clear the fields where the system name and type and other specifications are found, so it can be run the first thing after the file is opened
Input Single Run it will open some worksheets where some data should be pasted there
the worksheets that will be opened are the following:
single run equity: the picture of the equity curve from a single run should be pasted there
Single run drawdown : the picture of the drawdown of a single run should be pasted there
single run vami: the table of VAMI should be pasted (starting from cell A1)
single run trade distribution: the picture of single run trade distribution should be pasted
BOOTSTRAPPING the picture from a single run should be pasted there (it is found in the last page of the Amibroker report under Monte Carlo)Index Vami will open one worksheet to paste the VAMI of the Index (starting from cell A1)
Import MCs import the MCs result in CSV (so after finishing running MCs save the result directly from amibroker as csv)
Signal Variance import the MCs result in CSV (so after finishing running MCs save the result directly from amibroker as csv)
Data Variance import the MCs result in CSV (so after finishing running MCs save the result directly from amibroker as csv)
Rolling Windows results can not be saved directly from amibroker so the results should be copied and saved in excel file then they can be imported.Finally hit generate PPT and a new power point file will be opened and filled with the analysis of all the data that was imported.
finally
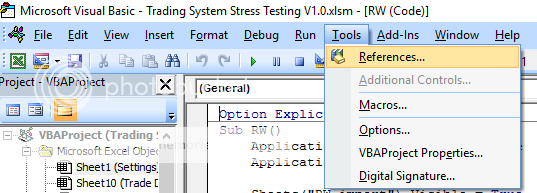
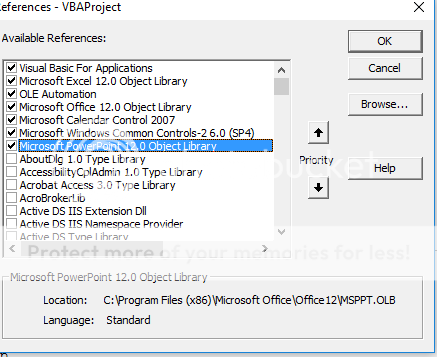
if you have MS office that is 2007 then you can ignore the following steps, if you have different versions then you need to do the following for the file to work.this is simply creating the communication between excel and powerpoint
Alt +F11

 April 24, 2016 at 7:05 pm #103615
SaidBitar
Participantattached are the excel file and a ppt that i generated for testing purpose with dummy data
this is what i thought for reporting if anyone has a better idea I am always happy to change. Also for any modifications or questions feel free to ask me.
April 25, 2016 at 3:07 am #103618LeeDanello
ParticipantHi Said this is an excellent initiative.
I use MSOffice 2007. I will test it and see how I go.
It would be nice to include a dummy trading system spreadsheet with the appropriate values in each sheet so that it’s easier to understand what is being generated by the macros.I found your 1st sheet a little bit difficult to understand, maybe the following is a little clearer?
Maybe some instructions in the appropriate Excel sheets of what to paste will make it easier. Instructions could be in cell A1 ie paste single run output from Amibroker etc
 April 25, 2016 at 10:34 am #103619
SaidBitar
Participant
I will make it clearer tonight, thanks for the feedback.
April 25, 2016 at 7:29 pm #103621SaidBitar
Participanthere you go,
inside the zip file are the following
updated version of the excel file
the presentation on how to use it
the presentation that is the resultApril 25, 2016 at 11:22 pm #103622LeeDanello
ParticipantThanks Said, You couldn’t have made it any easier
April 27, 2016 at 8:36 am #103623Anonymous
InactiveThanks for this Said.
I had a problem generating the PPT with the debugger jumping to: Set ppSlide = ppPres.Slides.Add(SlideNb, ppLayoutTitle) with the error Compile Error: Can’t find project or library.
The solution for me was to uncheck the “Missing” boxes from Tools->References in Visual Basic as described hereAll good now…
ps: I have Office V 16April 27, 2016 at 8:40 am #103632SaidBitar
ParticipantI have to make the code work regardless of the office version but it will take some time.
For the moment try to add power point from the reference
April 30, 2016 at 4:55 pm #103634LeeDanello
ParticipantHi Said, Your spreadsheet works pretty well. I wonder if you could reduce the font and the number of decimal places on some of the charts as they overlap.eg.

Also not sure why I didn’t get anything plotted on the following graphs. I input the data as requested

 April 30, 2016 at 7:50 pm #103653
SaidBitar
ParticipantGlad it worked
Regarding the font and decimal numbers I will modify to put the numbers vertically so they will not overlap
Regarding the other two graphs because the number is the same I mean it is always 5 days or 6 days it is not showing, honesty it should show tomorrow I will revise the file and update it
April 30, 2016 at 7:53 pm #103633SaidBitar
ParticipantDarryl Vink wrote:Thanks for this Said.
I had a problem generating the PPT with the debugger jumping to: Set ppSlide = ppPres.Slides.Add(SlideNb, ppLayoutTitle) with the error Compile Error: Can’t find project or library.
The solution for me was to uncheck the “Missing” boxes from Tools->References in Visual Basic as described hereAll good now…
ps: I have Office V 16Yeah this box refers to office 2007
I need to make it version independent because I am also planning to upgrade my ms officeMay 1, 2016 at 10:10 am #103654SaidBitar
ParticipantChange Log
1- Change the orientation of the labels on the x axis of the charts to vertical (90 degrees)
2- fix the chart problem when there is only one valueMay 1, 2016 at 10:11 am #103655SaidBitar
ParticipantChange Log
1- Change the orientation of the labels on the x axis of the charts to vertical (90 degrees)
2- fix the chart problem when there is only one valueMay 2, 2016 at 5:12 am #103616LeeDanello
ParticipantThanks for that Said. Now and again I get a macro error when I import the rolling windows data

All the sheets then become hidden and then I have to re-import the data again which seems to work.May 2, 2016 at 7:53 pm #103657SaidBitar
Participanttoday i found another problem that if the year return is zero the result of correlation is error

i will fix this tomorrowand i will check what Maurice talked about
-
AuthorPosts
- You must be logged in to reply to this topic.