Home › Forums › Trading System Mentor Course Community › Performance Metrics & Brag Mat › Secular Bull Takes Flight
- This topic is empty.
-
AuthorPosts
-
November 26, 2017 at 7:49 pm #101731
Nick Radge
KeymasterThe following topic was discussed by Donald Dony back in July at Noosapalooza.
This is another take on it.
It’s also why I have personally increased my exposure to US equities via the US Momentum strategy and the other, more aggressive strategy, DTVI.
Secular Bull Takes Flight
by Joshua Brown
Source: The Reformed BrokerThe secular bull market that began in the spring of 2013 for US stocks had subsequently been tested by a sub rosa correction in both earnings and stocks from 2014 through the midpoint of 2016. Beyond the largest 100 companies, stocks had been crushed, although it didn’t really show up on the surface of the averages.
And now, a year and a half later, the secular bull market has emphatically broadened out. I think breadth is notable and worth paying attention to, from my experience with the two crashes I’ve lived through during the course of my career. In both instances, a majority of stocks were not playing along as the markets were topping out. In both 2000 and 2007, if you were watching, this was a pretty darn good tell (in hindsight, of course, always in hindsight).
The fact that the median stock was getting destroyed during the 2014-2016 earnings recession – which was largely driven by the oil price crash – is something that was definitely disconcerting at the time. But that has since resolved itself to the upside without having dragged the overall market down with it. Energy and commodity-related earnings have been recovering and this has boosted the S&P 500’s earnings picture over the last several quarters.
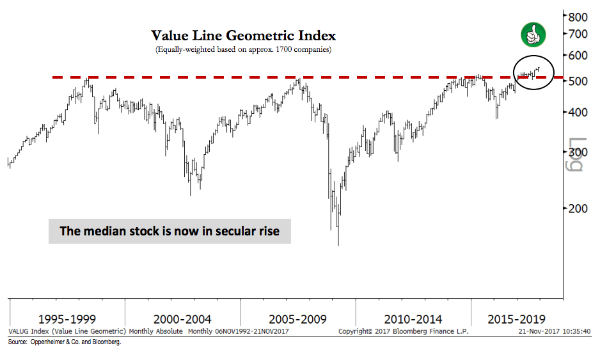
My friend Ari Wald (Oppenheimer) has a great chart illustrating the comeback we’re seeing for the median stock in the index. FAANG is not nearly as aberrant as you might think – every secular bull market has its generals, the stocks for which a majority of the gains accrue to. Why should the 2013-2017 advance have been different? Of course, the dominance in the FAANG components is still raging on, but this is not to the detriment of the bigger picture. Because now the median stock is breaking out above the old market tops from 2000, 2007.
Here’s Ari’s chart and comment:
Quote:Advance Is Broader than Many RealizeThe message coming from our research is that the S&P 500 is in the midst of a healthy middle innings advance and investors should participate by buying cyclical sectors, like Technology, Financials, and Industrials. One key point we continue to stress is the broad-based nature of the rally. For instance, the Value Line Geometric index, an equal-weighted aggregate of approximately 1,700 companies, has broken above secular resistance dating back to the year 2000, and is accordingly positioned for additional gains, in our view. Rallies that include the participation of many stocks are typically the rallies that continue (or conversely, internal breadth typically narrows into a market top), and with the S&P 400 and S&P 600 indexes also making new highs with the S&P 500, we expect strength to continue.

Last week witnessed a new all-time high for the Nasdaq 100, Dow Jones Industrial Average, Russell 2000, NYSE Advance-Decline Index and a new 52-week high for the All Country World Index-ex US. You’re welcome to interpret that as a negative indicator if you feel the need to, but you’d be on the wrong side of one hundred years of market history.
These things end with a narrowing, not a broadening. Which could certainly happen – it’s just not happening right now.
-
AuthorPosts
- You must be logged in to reply to this topic.