Forums › Trading System Mentor Course Community › Progress Journal › Sean’s Journal
- This topic has 100 replies, 2 voices, and was last updated 3 weeks, 2 days ago by
RichardKoziel.
-
AuthorPosts
-
April 27, 2023 at 7:59 am #115415
Sean Murphy
ParticipantA brief update to jot down some progress over the past 3 weeks.
My first system build is complete. ‘Emerging Momentum – EMO’ is a thing. Reaching this point is somewhat of a surreal experience. For a couple of years I have had an idea festering in my mind, and now it has emerged into an “operational” system. Was the path straight; no. Did the path go in the direction as I might have pre-empted; no. Did I learn a lot; yes.
My original idea was an attempt to capture early movement in prices as momentum accelerated through a ROC threshold of 30% over a period of say 100 days, operating on a daily basis, and ride the momentum until tipped out. However, we quickly found that while the concept was logical, there was a lot of noise among those signals. By varying regime index and restricting the universe to the small end of ASX town, we were able get something to work. But, optimisation showed there was a lot of variability induced by the period over which ROC was taken. It was just a little too jumpy operating at a daily time step. So, Nick suggested a raft of ideas to consider, including, weekly time steps, additional entry criteria like a breakout of some sort, changing regime index, and maybe different universe in an attempt to distill the signal from the noise.
Taking these on board, I went to weekly time steps, applied a more standard regime filter of the XAO, applied a Bollinger Band breakout together with ROC breakout, and presto, something that has usable metrics. Optimisation showed increased stability/robustness in the parameters, compared with the daily system, which led me to align values of some variables and simplify further. MCS, with 5% skip trades, showed reasonably tight performance over the period 2005-2023; average CAR 22.16%, MaxDD -23.32%, MAR 0.95, and Profit Factor 2.09, win rate ~48%.
While I developed this strategy on the $0.25-$10.00 universe of the ASX, I took it to the $0.25-$500 universe of the XTO. I accept there is some overlap in symbols between those two universes, but the backtests still performed. In some ways, it was a smoother ride; a higher win rate, but a little less CAR. So, this gives me some comfort that in a partially unseen universe, the strategy was robust and gives food for thought of a variant of the strategy to apply to a different universe with higher turnover.
When comparing trades with the WTT over the same periods, EMO picks up different symbols, and perhaps earlier than the WTT. So, a little bit of diversity there for me.
Onward.
April 30, 2023 at 10:15 am #115416Sean Murphy
ParticipantHalf way through the month, my ASX WTT looked like it was heading to all cash, before receiving signals late in the month to take it fully invested.
ASX WTT -2.0%
ASX MOMO 0.7%
Managed Growth Fund 3.6%Total 2.2% taking total drawdown to -21.8%.
May 2, 2023 at 11:46 pm #115417Sean Murphy
ParticipantAfter bedding down the momentum side of my strategy toolbox, I am now looking to develop a MR strategy to complement them. This is a real challenge for me, as my understanding of the essential components of MR systems is less clear. As I have had zero experience trading these types of systems, I have little experiential or theoretical knowledge. From reading the posts, I can clearly see the success and enthusiasm for these approaches that people are having, vis, Julian, Glen, Terry etc. I have searched/read/analysed many posts and threads trying to wrap my head around the essentials.
My objective over the coming days is to have a go at coding even the simplest MR system (e.g. RSI(2)) or ATR band) and progress from there. I am hoping that this gives me a better understanding of the essential components, and what levers to push and pull.
May 3, 2023 at 4:27 am #115586JulianCohen
ParticipantIf you have moved to RealTest Sean, then a good place to start would be looking at Marsten’s examples as there are a number of fully coded working strategies in there. Not meant to be traded as is of course, but all the principles are there for you to study and play with.
May 3, 2023 at 7:21 am #115587Sean Murphy
ParticipantThanks Julian for the lead.
Today I downloaded RealTest, so I can hopefully check out the mechanics in those strategies for the principles and add them to my thinking. I feel I am at the very beginning of a steep learning curve!
Cheers
May 3, 2023 at 11:00 am #115418Sean Murphy
ParticipantOoops, I’ll do that again and insert the images.
May 3, 2023 at 11:03 am #115419Sean Murphy
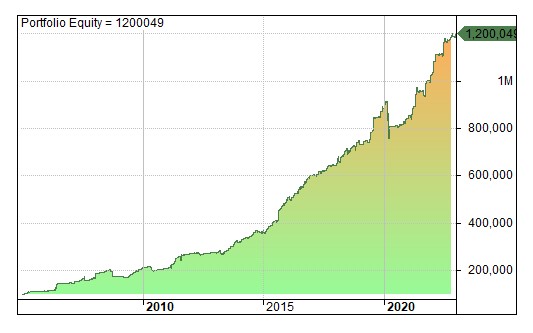
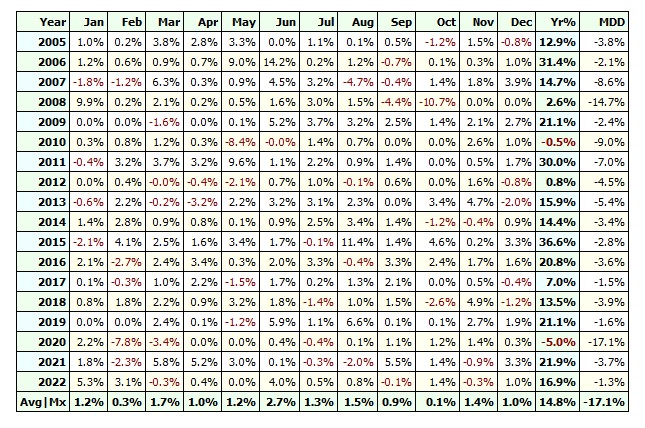
ParticipantA day of progress for me in gaining some understanding of the MR code and getting something that has an upward equity curve! I’ll take that as a win. Thanks Craig and Julian for your pointers. At least I now understand a little bit of the mechanics.
The equity curve below may not be that pretty, but to me its a beautiful thing, haha. My first go at a weekly system, signaled by an end of week close below an ATR channel, a stretch entry, and close on Friday. I think I am beginning to see the light.
Onward.
 May 4, 2023 at 6:32 am #115588
Sean Murphy
ParticipantToday looking at using the same setup, as previous post, but instead of using a same week exit, I tried running on a daily time frame and exit signalled by a simple cross of short term MA. Simple 10 positions by 10% equity, no leverage.
Again, not so much the end result is important, as my understanding of the options that might exist.
For reference, CAR 17.7%, MAR 1.0, Avg P/L 1.49%
May 4, 2023 at 7:04 am #115589JulianCohen
Participanttry C > C[1] as an exit….often makes a big difference especially with strategies with a lot of setups, as it gives a profitable trade an opportunity to close and allow another trade to have a go
Also try playing with the ranking choices…that can make a big difference too
May 4, 2023 at 9:51 am #115590Sean Murphy
ParticipantThanks Julian. Yes, I will have a go at the higher close exit too. My knowledge of how to apply the different ranking approaches for these short term systems is a work in progress. I have noted down a few from threads and posts. So, its a matter of me trying them to see what happens and get a feel for what they are doing. Cheers.
May 4, 2023 at 10:48 am #115591Sean Murphy
ParticipantWell, I do have a lot to learn, don’t I.
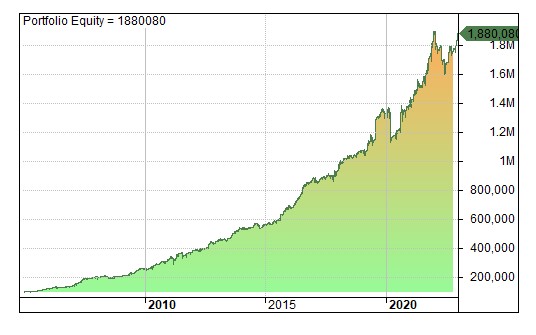
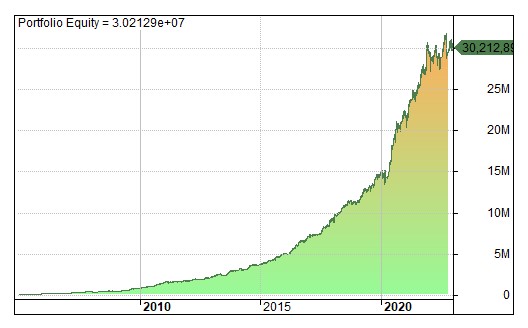
Two equity curves. The first, from my post earlier this afternoon, and the second, following Julian’s suggestion of changing the exit to a higher C and changing the ranking method to ATR(5)/C.
# trades increased from ~2000 to ~5000, and number of winners increased from 1300 to 3400. There was a modest drop in W. Avg. % Profit from 4.95 to 3.92. and modest improvement in L. Avg. %Loss from -4.75 to -3.66. The power of large numbers.
Daylight and dust.
 May 5, 2023 at 3:53 am #115592
JulianCohen
ParticipantLooks like a drop in MDD too but hard to tell from that chart
May 5, 2023 at 6:32 am #115593Sean Murphy
ParticipantSorry Julian, its hard to tell from that chart. MDD increased from -17.67 to -24.37, but MAR went up from 1.00 to 1.53.
I’m very much feeling my way around with this type of system. Thanks for your interest.
May 6, 2023 at 7:28 am #115594JulianCohen
ParticipantNo problem at all. Happy to help if I can
May 12, 2023 at 5:33 am #115595Sean Murphy
ParticipantAnother week, another week of learning. The week seemed like an adventure into a deep, dark, rabbit hole of CBT code. But, I popped out an exit to see the light once more.
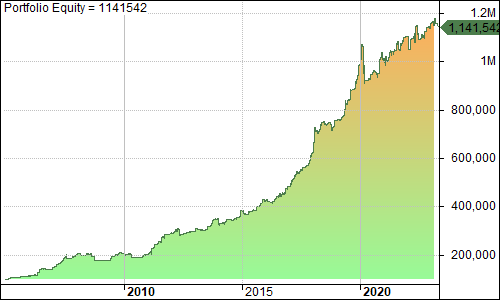
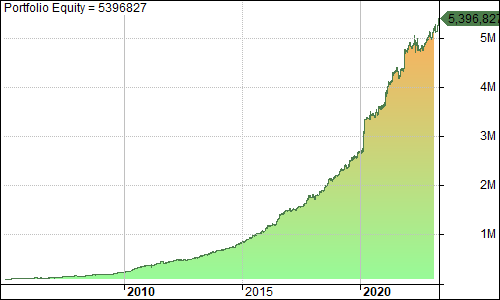
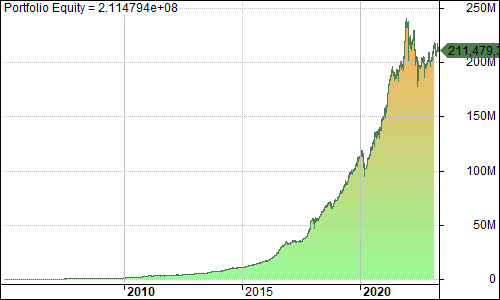
This post is a about my learning of the impact of time frames. My original thought for the strategy was to look for a system that operated at a weekly time frame, aiming to enter during the week on a stretch, and exit on Friday at close. After working with Nick and Craig, this idea morphed into a multiday swing system. The charts below show the same parameters operating on the same ASX Universe, but in three different time frames. Weekly same bar exit, Daily same bar exit and Daily multibar exit on higher C. Each approach offers differing benefits, vis, CAR, MAR, MaxDD, MaxWait, LBIT, etc.
Weekly same bar exit = lowest trade # but highest W. Avg. % Profit and Avg % Profit per trade.
Daily same bar exit = smallest MaxDD, smallest Avg % Profit per trade, but highest trade #
Daily multibar exit = highest Win %, highest CAR, but highest MaxDD, with highest MAR, and obviously, longest LBIT.Which horse, on which course?
-
AuthorPosts
- You must be logged in to reply to this topic.