Home › Forums › Trading System Mentor Course Community › Trading System Brainstorming › Reducing Entry Signals
- This topic is empty.
-
AuthorPosts
-
February 15, 2017 at 7:21 am #106251
TrentRothall
ParticipantKerry,
You probably have already tried but have you looked into either tightening your parameters up or moving your entry level further away from the signal bar? it might help your % gain per trade too
February 15, 2017 at 8:50 am #106250SaidBitar
MemberKerry O’Keefe wrote:It seems the biggest factor is the size of the Universe – with the smaller historic watchlists for USA limited to S&P100, and Nasdaq, the next jump up is the Midcap 400 (which my systems work pretty well on – selection bias aside) Has anyone tried creating a smaller custom watch list of say, the 100 – 300th largest companies? The Nasdaq and S&P don’t have the same price movements as those smaller firms, and I don’t really get great results with them. The biggest issue here of course is finding historic data for the new Universe. But I’m just trying to get a smaller universe!
My observations:
it is true that if you test any system on large universe such as R3000 your results will be wonderful maybe you will be achieving the CAR in the range of 70% but this is not realistic due to the universe size the results will be tough to replicate and another thing if you take R1000 out of R3000 the system will start looking bad same if you take the S&P500 out of R1000 so what i want to say is that the high capitalised stocks such as the ones in S&P500 are the ones that tend to revert to the mean most of the time so it will be good if you can concentrate on this.Regarding reducing the signals here is what you can do it will consume some time the first time then it will be faster with time. When you are designing the system do not through all the stuff at once and backtest try to add them one by one and note down the effect of each condition for example assume you want to test the three lower lows system
maybe you can use this sequence:
1- entry 3 consecutive lower lows, exit higher close
note down the results (number of trades taken , number of possible trades, DD, longest DD expectancy, ..)
2- add the moving average to define the stock is in uptrend
note down the metrics
3- add limitations on price and volume
note down the metrics
4- increase the entry stretch
and so on
you will notice that with each condition the numbers will change number of trades taken / possible trades will start going up, number of trades will get smaller, CAR smaller DD smaller but everything will be more realisticFebruary 15, 2017 at 10:04 am #105940JulianCohen
ParticipantMy question is does it really matter?
As long as you are fully aware of selection bias and it’s effects, which most traders are not, and as long as your MCS testing has narrowed down the mins and max averages to something that you are comfortable with, and as long as your trading system stays within those averages, does it make a difference if the number of trades taken is 100% of signals or 80% of signals. If it is 80% you know that you will still have a system that can perform robustly, but at the lower levels of your MCS testing, which in reality is the best you should hope for.
Am I way off on my thinking?
February 15, 2017 at 11:06 pm #106254ScottMcNab
ParticipantJulian Cohen wrote:My question is does it really matter?As long as you are fully aware of selection bias and it’s effects, which most traders are not, and as long as your MCS testing has narrowed down the mins and max averages to something that you are comfortable with, and as long as your trading system stays within those averages, does it make a difference if the number of trades taken is 100% of signals or 80% of signals. If it is 80% you know that you will still have a system that can perform robustly, but at the lower levels of your MCS testing, which in reality is the best you should hope for.
Am I way off on my thinking?
+1…..wouldlove to know potential impact..is may depend on the system …maybe a trend following system which relies on a few big winners to offset multiple losers would be more susceptible than a high frequency intra-day system ?
February 15, 2017 at 11:18 pm #106255LeeDanello
ParticipantScott McNab wrote:Julian Cohen wrote:My question is does it really matter?As long as you are fully aware of selection bias and it’s effects, which most traders are not, and as long as your MCS testing has narrowed down the mins and max averages to something that you are comfortable with, and as long as your trading system stays within those averages, does it make a difference if the number of trades taken is 100% of signals or 80% of signals. If it is 80% you know that you will still have a system that can perform robustly, but at the lower levels of your MCS testing, which in reality is the best you should hope for.
Am I way off on my thinking?
+1…..wouldlove to know potential impact..is may depend on the system …maybe a trend following system which relies on a few big winners to offset multiple losers would be more susceptible than a high frequency intra-day system ?
The larger the selection bias then the larger the spread in your MCS. If you’re happy with the lower end of your MCS, then selction bias isn’t an issue. I did some testing and found that in order to remove most of the selection bias or approach the stats that Nick posted, I should be trading 20 positions instead of 10 so to get the maximum bang for buck out of my system that means using margin. 10 positions allows 75% of signals taken, whereas 20 gives me about 90%. That’s a bit of a no brainer.
February 16, 2017 at 12:11 am #106256TrentRothall
ParticipantMy thoughts…
Along the lines of Julian and Scott, a MOC system relies on high frequency of trades to create an edge because of the low profit potential of each trade ( it can only go so far in one session). So in theory the more trades the better. The problem is in the testing you have no idea which trades would trigger first in real time or if the trades that trigger first are even profitable… Maybe a way to help in testing could be to set all commissions to 0 and have max 500+ positions to capture all trades and then sort in excel or whatever to review the expectancy of the trades and make sure the average is the same or very close as a single run with normal operating number of positions i.e 20? thoughts..
At least when you know you are capturing +95% of the trades and the system is profitable, it is more obvious that the bulk of signals should result in a +ve outcome in the long term, and you aren’t just capturing ‘noise’ like Nick says
February 16, 2017 at 12:22 am #106257Nick Radge
KeymasterAs I’ve stated I will add a new section into the LMS about his once Craig returns – so probably next week.
I have drawn a diagram to help explain to some but the essence in a downside gap most of the fills will occur very close to the open. If prices move down then close off the lows then any fills on or near the open will more than likely result in a loss. This is the real time result.
However, when we do an MCS AB will take a selection of random trades from throughout the entire session – including ones that occur toward the trough. The ones picked up in that trough will result in a profit but in real time these would not have been executed because the allocation was fulfilled near the open.
February 16, 2017 at 3:30 am #106258ScottMcNab
ParticipantThanks Nick.
Along the lines of Trent’s post above (calling excel ppl !), what about the idea of setting max positions to 200+, exporting results to excel, then selecting worst 40 positions (or whatever your position size is set to) for each day and then calculating a worse case scenario for the returns by exporting these selected entry and exit prices to calculate CAGR, maxDD and expectancy
overkill ?
February 16, 2017 at 8:50 am #106262SaidBitar
MemberScott McNab wrote:Thanks Nick.Along the lines of Trent’s post above (calling excel ppl !), what about the idea of setting max positions to 200+, exporting results to excel, then selecting worst 40 positions (or whatever your position size is set to) for each day and then calculating a worse case scenario for the returns by exporting these selected entry and exit prices to calculate CAGR, maxDD and expectancy
overkill ?
hahaha
I like the idea the worst scenario ever then based on it everything will be better i can make this excel file and share it later today so you can paste the result of the backtest it will keep the worst x for each day where x is the maximum number of positions that your system allows then generate the equity curve DD CAR ..regarding reducing entry signals somehow my thoughts are more aligned with Julian and the others but it should be above 75% less than this the variations will be huge
February 16, 2017 at 8:50 am #106263SaidBitar
MemberScott McNab wrote:Thanks Nick.Along the lines of Trent’s post above (calling excel ppl !), what about the idea of setting max positions to 200+, exporting results to excel, then selecting worst 40 positions (or whatever your position size is set to) for each day and then calculating a worse case scenario for the returns by exporting these selected entry and exit prices to calculate CAGR, maxDD and expectancy
overkill ?
hahaha
I like the idea the worst scenario ever then based on it everything will be better i can make this excel file and share it later today so you can paste the result of the backtest it will keep the worst x for each day where x is the maximum number of positions that your system allows then generate the equity curve DD CAR ..regarding reducing entry signals somehow my thoughts are more aligned with Julian and the others but it should be above 75% less than this the variations will be huge
February 16, 2017 at 9:10 am #106271SaidBitar
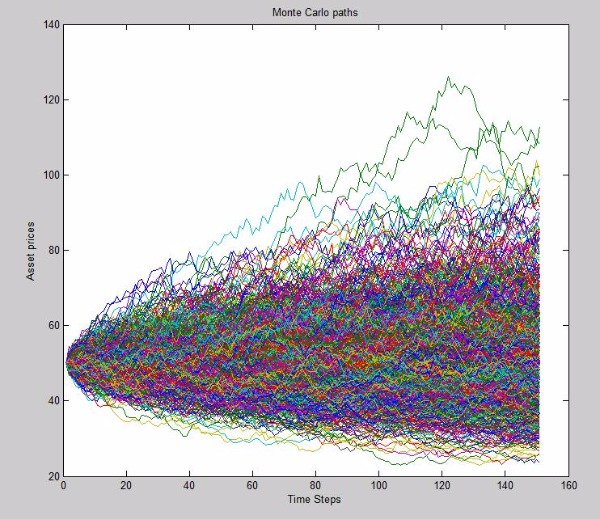
MemberActually i have better idea than the excel file, you know some tools such as Matlab has the ability of plotting all the MCs equity curves but Amibroker doesn’t at least not in the same way.
I can develop one small tool over the weekend that will do the job so the input of it will be the CSV file that is the export from Amibroker when you run your code with huge number of entries such as 200 and without any trade skipping then you have to enter the following information maximum allowed trades per day and the position size and it will generate all or most of the equity curves with the correct position size and the equity curve.
this will help in showing the worst, best, and the average as well as all the other equity curves.so the output will be something in the lines of this image
 February 16, 2017 at 7:22 pm #106270
ScottMcNab
ParticipantIt would just need inputs for the max no of positions and the initial equity I guess (advice from the master coder)
February 19, 2017 at 9:30 pm #106275SaidBitar
MemberWoo
It was supposed to be two hours job then it took 2 days the reason because i wanted to use serverless database SQLITE and I never used it before.
Anyhow it is 80% ready still there are some things to be done but here it is for verification and testing.
First i will explain how to use this tool then i will explain the logic behind it (this will help to clarify the math)
first run backtest in Amibroker without any commissions and set the maximum number of positions to 200 (for example) and position size to 1% the aim is to get the maximum number of possible trades. then save the CSV file.
here is some manual work but i will code it when i will have the time. Open the CSV file that is the export from Amibroker and under the column R add the following: in R1 add “Sdate” in R2 add
“=CONCATENATE(YEAR(C2),IF(MONTH(C2)<10,CONCATENATE("0",MONTH(C2)),MONTH(C2)),IF(DAY(C2)<10,CONCATENATE("0",DAY(C2)),DAY(C2)))"
drag the function all the way down then make select for the column and copy then paste special as value
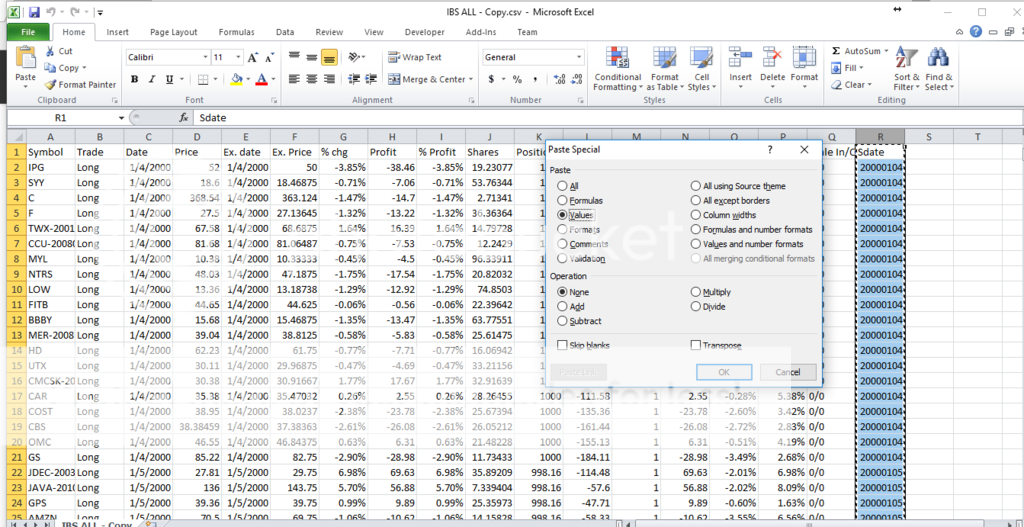
hit the save button and close the file
the manual work is overthe tool is found inside the attached folder
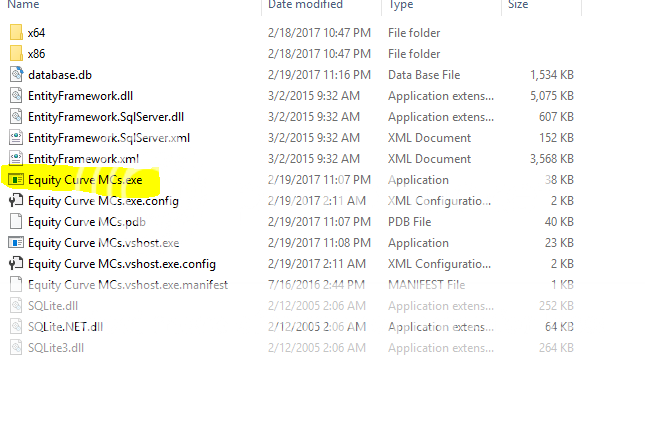
whe you open you need to fill the number of maximum open positions, positions size (10 for 10% and so on) and for the MCs still it is ongoing
February 19, 2017 at 9:46 pm #106284SaidBitar
Member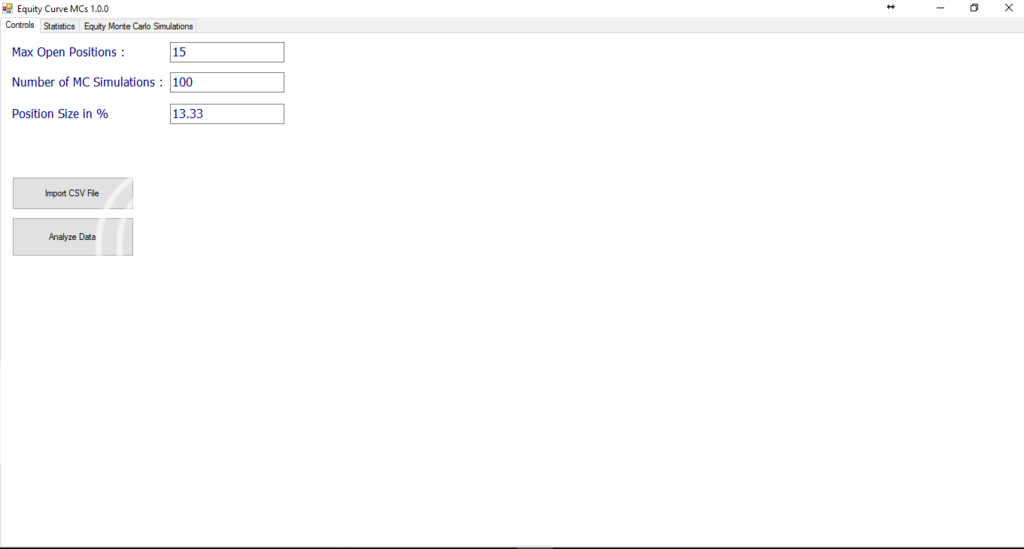
then you need to hit the Import CSV button pick the file that is already modified and wait
 it is a bit slow depending on the size of the file
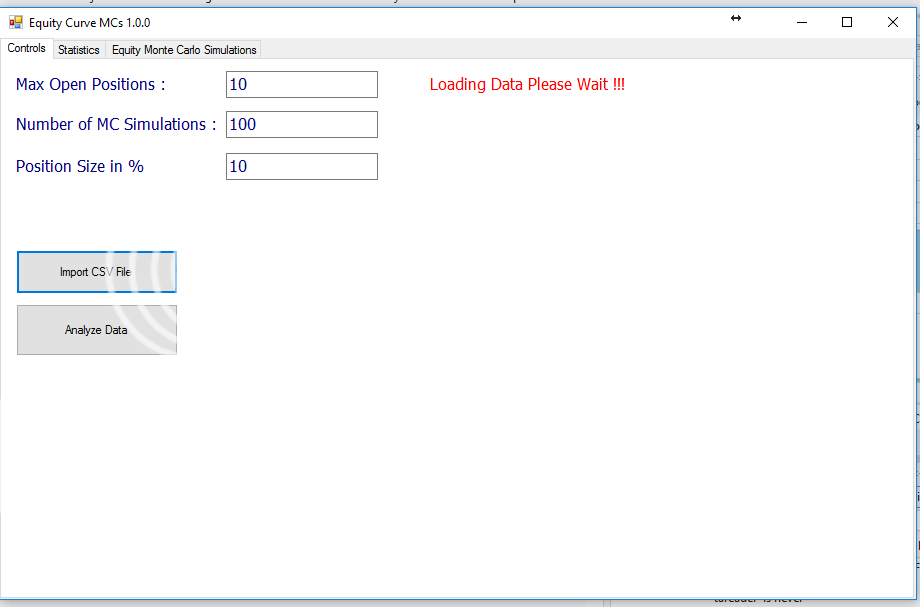
when the file is imported to the database it will mention that the data is ready
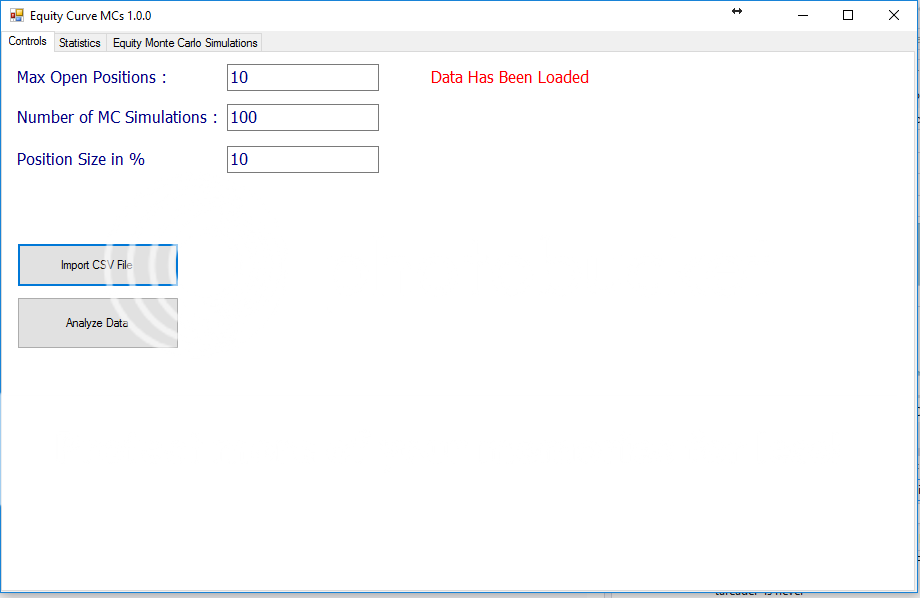
then hit Analyze data when the data is ready it will go to the second tab and will display the statistics
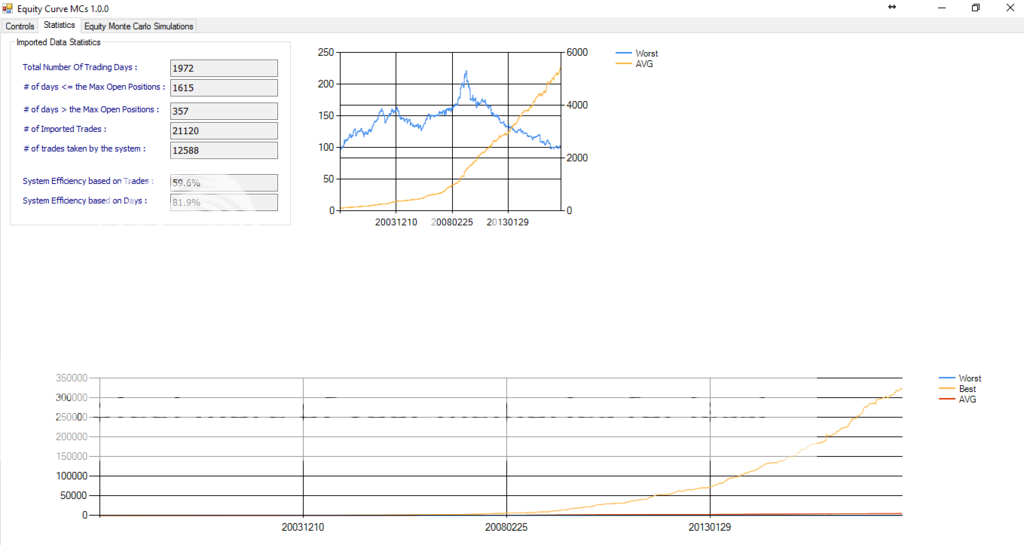
the calculations are done as follows:
the days are divided into two categories days where the maximum possible trades are less than or equal to the max position and in this case the backtest and the reality should be equal and days where the possible trades are more than the max allowed position here where the deviations will come from.
then for all the days the top x trades (x is the maximum number of positions) and are added together divided by the positions size to get the percentage of equity and put under Best the same for the worst x trades and put under worst and the average is under average. regarding the table where the number of trades are less than or equal to the maximum allowed position the best, worst, and average are the same since for these days there is no option of picking trades.then all the days and their values are put together again and the equity curve is calculated as follows:
Day1 100 + GainDay1
Day2 (1+GainDay2/100)*the result of the previous day and so onthese is the data behind the graphs but due to the fact that the best is very good and causing the worst and average to look not clear i added another graph for the worst and average and they have separate axis
February 19, 2017 at 9:54 pm #106286SaidBitar
Memberwow it is not allowing me to attach the file it is only 3M and zipped
still it is saying that the size is huge
anyhow here is the link to download it
https://www.dropbox.com/s/7byni28fxm202od/MCs%201.0.0.zip?dl=0
-
AuthorPosts
- You must be logged in to reply to this topic.