Home › Forums › Trading System Mentor Course Community › Trading System Brainstorming › Reducing Entry Signals
- This topic is empty.
-
AuthorPosts
-
December 11, 2016 at 3:24 am #101599
JulianCohen
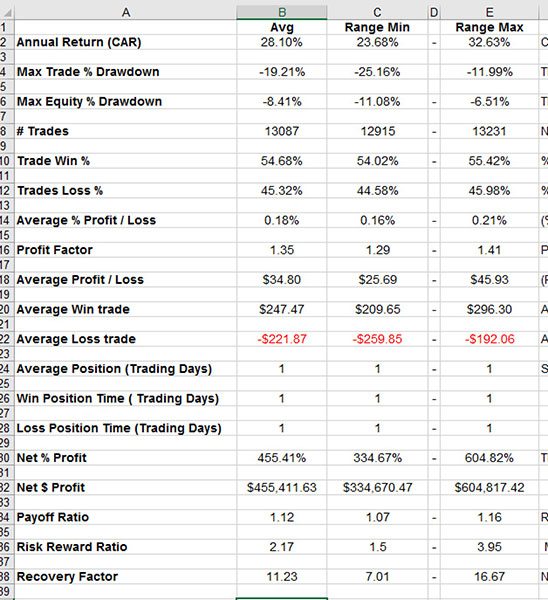
ParticipantI have a system that I have been working on that produces good metrics but a lot of trades. I’m fine with this, but it also produces a huge number of entry signals compared with the trades taken.
Is there a way to reduce the entry signals? I have tried a number of filters but there seems to be a tipping point where any changes made keep the same number of trades, but then suddenly the trade numbers drop off and the metrics are adversely affected. Probably because I am running on 54-55% Win Rate and the filters drop this to 52% or so.
The sign maybe of a not so robust system…
The other question is do I need to reduce the entry signals?

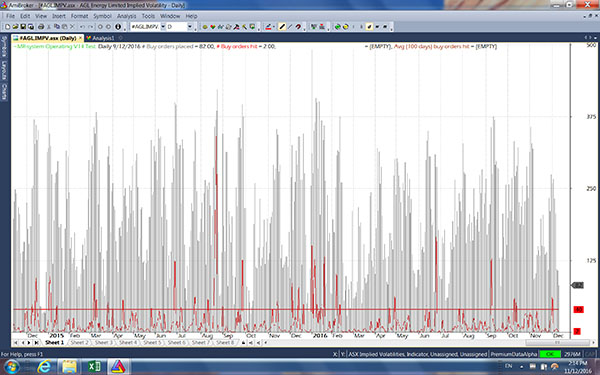
The red line is the 40 trade cut off

This is 2010-2016, 1000 runs at 25% skipping
December 11, 2016 at 8:33 pm #105939Nick Radge
KeymasterMetrics appear close to the noise…you may find real time trading will not be as favourable.
Have you tried reducing the universe right down? yes, that will impact results but may be more realistic in real time.
December 11, 2016 at 9:09 pm #105953JulianCohen
ParticipantYes reducing the Universe to say S&P 100 cuts the CAGR down to 6%
OK I thought it might be too good to be true

Back to the drawing board then ha ha
December 11, 2016 at 11:30 pm #105955Nick Radge
KeymasterTry more volatile stock – such as the NASDAQ 100 instead of S&P 100
December 12, 2016 at 12:42 am #105956JulianCohen
ParticipantNick Radge wrote:Try more volatile stock – such as the NASDAQ 100 instead of S&P 100OK I will. Thanks a lot. i’ll let you know how I go. I’m going to try adjusting some of the parameters to see if I can tighten things up a bit too.
Have a fun trip!
December 12, 2016 at 7:21 pm #105954SaidBitar
MemberNick Radge wrote:Metrics appear close to the noise…you may find real time trading will not be as favourable.:woohoo:
Stupid question from me

how the metrics should look like, I tested one system over the same duration and the results are not far from Julian’s with exposure of 17%CAR 32% DD 6% % winning trades 56.36% and number of trades is 11650
December 13, 2016 at 12:50 am #105958ScottMcNab
Participant32 CAR with 17 exposure nice ! Julian’s graph would seem to imply higher exposure (>50%) ? How does your buysignal plot look Said ?
Julian.. have you tried maybe adjusting the stretch based on the behavior of the index as well as the individual stock ?
Rule of thumb I use: profit factor >1.5 as mentioned previously…I also aim for av profit/loss % on SPX > 0.2 (ideally 0.25%) and ASX >0.3 (ideally 0.4% or better)
December 13, 2016 at 1:47 am #105959TrentRothall
ParticipantExposure confuses me…
It isn’t as simple as 17% of the time you have a position on is it?
or is it
on average 17% of your capital will be invested at any one time?
December 13, 2016 at 2:39 am #105960JulianCohen
ParticipantScott McNab wrote:32 CAR with 17 exposure nice ! Julian’s graph would seem to imply higher exposure (>50%) ? How does your buysignal plot look Said ?Julian.. have you tried maybe adjusting the stretch based on the behavior of the index as well as the individual stock ?
Rule of thumb I use: profit factor >1.5 as mentioned previously…I also aim for av profit/loss % on SPX > 0.2 (ideally 0.25%) and ASX >0.3 (ideally 0.4% or better)
Yeah I’ve tried everything ha ha. I think I’m gonna bin this one and start again. I can’t get it up anywhere above 54% Win Ratio and that means it has to have a bigger universe to work. So probably the real results will be less than the MCS results.
I think I would prefer to have around 56% or higher win ratio in order to make a system work on a smaller universe as an MOC system.
I might look to make this system a Swing/MR system instead and see how it performs.
December 13, 2016 at 6:41 am #105961ScottMcNab
ParticipantTrent Rothall wrote:Exposure confuses me…It isn’t as simple as 17% of the time you have a position on is it?
or is it
on average 17% of your capital will be invested at any one time?
Confuses me too… I think along the lines (probably incorrectly) of:
total possible positions (100%) = number of trading days X number of positions
(eg 250 days x 20 positions = 5000)
then
add number of positions for each day
day1: 5 positions
day2: 18 positions
etc
day 250: 12 positionsthen total them for the 250 days
so 17% exposure would be 850 positions (in any combination) spread over the 250 days:S
December 13, 2016 at 7:09 am #105962TrentRothall
ParticipantDon’t think that’s right i just ran a test on 2015. I had 278 trades with max 20 positions
AB exposure = 7.59%
Your formula = 5.56%
So i don’t know..
I had one trade today, ran a backtest today with 20 pos at 5%
Exposure = 2.54%
20 pos at 10%
exposure = 5.1%
December 13, 2016 at 9:15 am #105963JulianCohen
ParticipantTo quote ‘The Leader’
Exposure % – ‘Market exposure of the trading system calculated on bar by bar basis. Sum of bar exposures divided by number of bars. Single bar exposure is the value of open positions divided by portfolio equity. In layman terms exposure means how much time you’re invested in the market. Buy and hold would be 100 and 10 would mean you’re invested just 10% of the time. This can be beneficial to discern how much capital is being used with the strategy and therefore offers an insight on the ability of using the same capital to trade other strategies.
December 13, 2016 at 9:29 am #105964ScottMcNab
ParticipantTrent Rothall wrote:Don’t think that’s right i just ran a test on 2015. I had 278 trades with max 20 positionsAB exposure = 7.59%
Your formula = 5.56%
So i don’t know..
I had one trade today, ran a backtest today with 20 pos at 5%
Exposure = 2.54%
20 pos at 10%
exposure = 5.1%
Just had a quick look in help file in AB…seems to relate to value of open positionsrelative to portfolio equity rather than number of positions
December 13, 2016 at 9:32 am #105965ScottMcNab
ParticipantI think what we are more concerned with is determining the frequency with which buy signals > positions available….so exposure is not the metric for us it would seem ?
December 13, 2016 at 10:11 am #105966ScottMcNab
ParticipantSome initial thoughts….
eg system has max of 20 positions…and over 4 days buysignals total 6, 22, 4, 30Metric 1: the higher the better as want system operating close to maximum capacity ?
(sum of buysignals* for each bar) / (max open positions x bars) *100
*buysignals must be capped to be no greater than max open positions
eg (6+20+4+20)/(4×20) *100 = 62.5Metric 2: the lower the better
(number of bars in which buysignals>max open positions)/(number of bars)
eg 2/4*100 = 50Metric 3: a weighting to determine how significant buysignals exceed positions available when it occurs…the lower the better
sum of (buysignals/maxopenpositions) for each bar that it occurs
eg 22/20 + 30/22 = 52/20 = 2.6Metric 4: overall score….higher the better
Metric 1 – metric 2 – metric 3
eg 62.5 -50 – 2.6 = 9.9Just inital thoughts…with a bit of weighting and fiddling we may get something ?
-
AuthorPosts
- You must be logged in to reply to this topic.