Forums › Trading System Mentor Course Community › Running Your Trading Business › Performance Tables
- This topic is empty.
-
AuthorPosts
-
August 5, 2021 at 4:19 am #102016
KateMoloney
ParticipantHi Nick,
I just watched your video about the performance tables;
https://www.thechartist.com.au/portfolio-management-software/
Do you just fill in the gross trading P & L and add the dividends & interest separately?
I tried using the net P & L, but the numbers were too high, assuming it is because it included unrealised profits?
August 5, 2021 at 4:22 am #113681KateMoloney
ParticipantAlso, do you have any videos or information about VAMI tab on share trade tracker?
Not sure if it is user error, but the data seems incorrect on the VAMI tab. For example gross profit and loss is completely different to the gross P & L I get when I run a report for that same time period (or what is reflected on the summary tab).
August 5, 2021 at 7:51 am #113684Nick Radge
KeymasterI don’t use the VAMI tables in STT as it doesn’t account for deposits or withdrawals, the same as the actual portfolio return number.
I do all performance calculations in the separate Excel sheet.
All I do is take the Net P&L figure out of STT. It accounts for all dividends, interest and commissions.
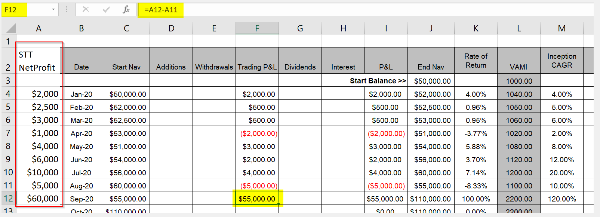
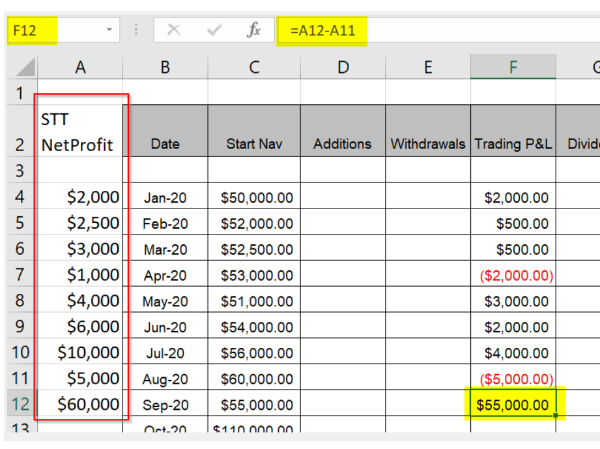
I then add that in column F and subtract the sum of all prior months in column F.
Basically I’m recording the change in Net P&L for the month out of STT (but STT can’t go back in time) which is why I do it each month after the close.
August 5, 2021 at 8:40 am #113685GlenPeake
ParticipantYep. What Nick said!!! That’s how I manage it as well

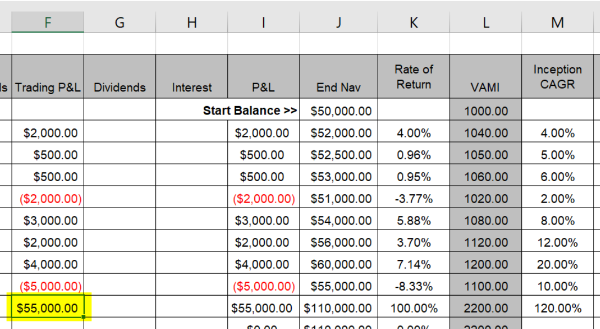
I’ve created a STT NetProfit column in the Performance tables spreadsheet and enter in the value from STT at the end of the month and subtract the previous month.

(Zoomed in screen shots below)


I have a unique TAB for each system and then can perform different ‘system combination’ statistics for each system. I.e. I can group all the MR systems into the one TAB and get an ‘overall’ % return for the MR systems combined etc.
 August 5, 2021 at 11:53 pm #113687
KateMoloney
ParticipantThank you Nick and Glen for sharing.
I spent a number of hours yesterday trying to figure out best process for this.
Grateful for this community.
August 6, 2021 at 12:15 am #113694Nick Radge
KeymasterIf you get stuck, send the sheet to me Kate. Essential that the data is updated at the end of each month though. You can’t pull it back out of STT after its been updated.
August 6, 2021 at 12:17 am #113686KateMoloney
ParticipantThanks Nick.
I have been using the report function and doing monthly reports to get the back dated monthly P&L. STT is such a great tool.
August 6, 2021 at 12:47 am #113695KateMoloney
ParticipantThanks Nick – will do.
Appreciate your help.
August 28, 2021 at 1:03 am #113682ChrisThong
ParticipantHi Glen,
May I know what does the inception CAGR mean?
August 28, 2021 at 5:25 am #113757GlenPeake
ParticipantChris Thong wrote:May I know what does the inception CAGR mean?
Hey Chris,
That’s the total return since going live with the system.
As time goes by, hopefully you’ll see this number get bigger and bigger
 August 28, 2021 at 9:05 am #113683
ChrisThong
ParticipantThanks Glen.
February 25, 2023 at 11:39 pm #113688#REF!McGrath
ParticipantHi Glen, how do you account for the US systems. If starting NAV is in AUD & STT Net Profit is in USD do you convert back to AUD at month end. Or alternatively have starting NAV as USD. There are also times where for the monthly systems you are sitting in cash which may be USD or AUD depending on currency movements. I have been reconciling to my IB account in both AUD & USD but looking to simply the reporting.
thanks
February 26, 2023 at 2:24 am #115452GlenPeake
ParticipantHi Gavin,
In a nutshell I track the system(s) performance in it’s own performance tab and record the monthly performance/profit from Share Trade Tracker all in US$. I’m interested in the performance of the system itself as traded (excluding currency conversion).
I have another performance tab in the Performance Tables spreadsheet which tracks my IB account NAV, which shows the total of everything in AU$….. cash/open positions/currency hedging etc.
Hope that helps.
-
AuthorPosts
- You must be logged in to reply to this topic.