Home › Forums › Trading System Mentor Course Community › Trading System Brainstorming › Monthly Rotation v2
- This topic is empty.
-
AuthorPosts
-
July 11, 2020 at 5:06 am #111851
JulianCohen
ParticipantI would say that is pretty good results there Michael. Your CAGR is greater than MDD. 20% a year is great.
How did it do before 2005….I find 2000 to 2005 was a challenging time.
July 11, 2020 at 12:53 pm #111865Anonymous
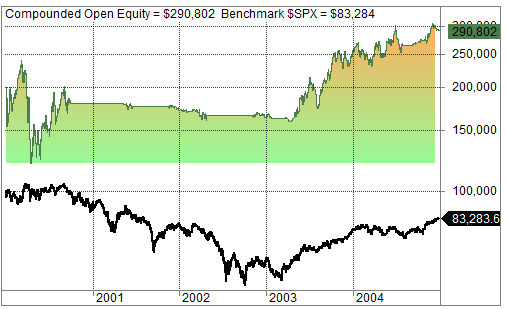
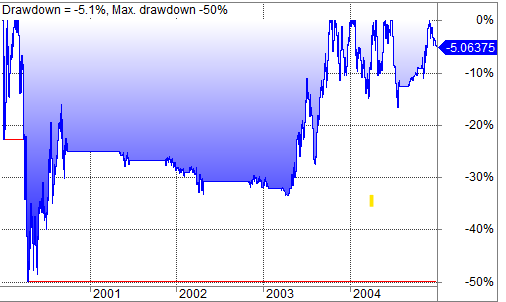
InactiveNot so well – better than the SPX Index, but most people would have cut and run (me included).
Combined Equity
NB Index starts at $100k / Combined Systems at $200k, so on like fr like basis, Inde would be $166k after 5 years
Combined DD
Combined Profit Table
 July 11, 2020 at 12:59 pm #111868
Anonymous
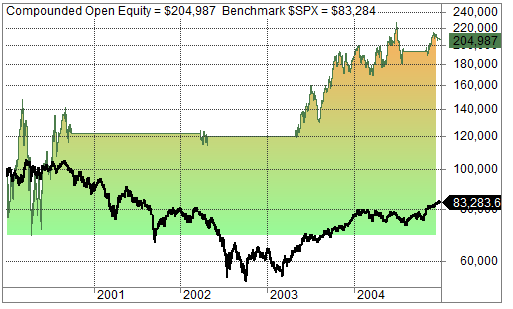
InactiveMonthly & Weekly standalone charts;
Monthly NDX Equity
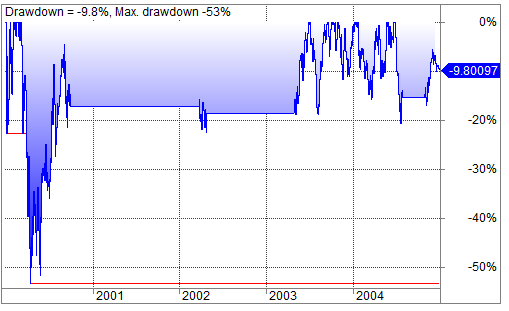
Monthly DD
Monthly Profit Table

Weekly Equity
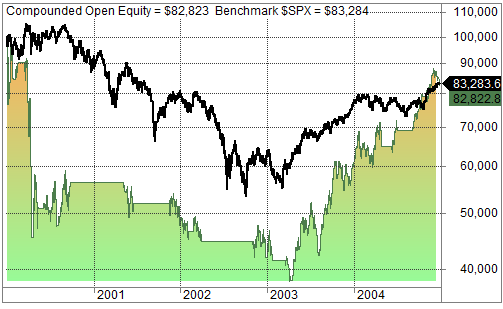
Weekly DD
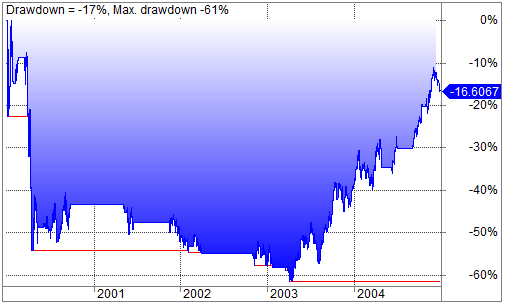
Weekly “Profit” Table
 July 11, 2020 at 1:06 pm #111869
Anonymous
InactiveBut never fear – MOC would have saved the day!
 July 11, 2020 at 1:36 pm #111870
Anonymous
InactiveThe interesting thing is that the Weekly version got slaughtered I think, as it uses a shorter Index filter – 100 days vs 200 for the Monthly.
Applying a 200 day index filter, the Weekly version improves slightly, as it isn’t getting involved as often during the poor periods.

There is no perfect solution.
The Monthly system got you out, and kept you out during the worst periods.The major DD was rapid and returned you to starting equity levels within a few months.
Here is a question – the 50% DD seen in the Monthly system, was right off the back of a couple of stocks growing fairly nicely in early months, then falling back to just about their entry levels, thus contributing the bulk of the 50% DD.
Do people investigate the causes of significant DDs, and understand what was the cause?
If you had strong performance from a couple of stocks, followed by their falling right back to create say 40% of the DD experienced – very frustrating, but not life threatening – unlike the situation of the other stock that contributed to the 50% DD – it just trailed down from entry point until exited after 6 months
July 22, 2020 at 4:19 pm #111871Anonymous
InactiveOne thing that I have just noticed in my testing work in the Monthly and Weekly systems – I had my Price and Volume Adjustments set to Capital Reconstructions, Special Divs and Ordinary Cash Dividends.
I understand the effect dividends can have on long term returns, especially for ASX systems.
However, in the development stages of a rotation / longer term system, which is the most suitable setting to use?


The impact on my NDX testing actually worsens with the inclusion of ordinary dividends.
Using my weekly version of my rotation system, for the period 1/1/2005 to date, I ran using the 3 Price & Volume Adjustments available, and got the following outcomes.

What seems to happen is that most trades remain unaffected. However, a number of trades have their timing of entry / exit shifted, and as such their gain / loss varies between the different variants.
As I use ROC for ranking, I assume that the price used for calculating ROC is slightly different, depending upon which price volume adjustment is used, which i turn could effect its rank.
Lesson for me – check what Price Volume Adjustment setting when running series of backtests over several nights! Spent time trying to work out why getting different results from previous test runs, and simply down to having a different Price Volume Adjustment setting in place, so need to be consistent.
July 22, 2020 at 10:08 pm #111925Nick Radge
KeymasterJust use the default settings
July 31, 2020 at 2:57 pm #111832Anonymous
InactiveHad a further chat with Nick in the week, to close out the development of my NDX Rotations – Weekly & Monthly. Thanks for the steers and help.
Final version kept simple.
Tried a couple of ideas as suggested by you guys, but could not make them work as effectively as you have (PDI rather than stock LTMA, for example) . Will continue to explore, but time to actually test it properly – in the market live.
Combined Equity and Drawdown for the Weekly and Monthly systems shown below.
These are with NVDA & MU included, 5 positions worst rank 10, and Gap Filter on.Only variation between Monthly & Weekly is the Index Filter LTMA period – 200 bars for Monthly halved to 100 for Weekly.
Consolidation is a simple 50:50 split between the 2 systems.
The effect on Drawdown helps smooth the journey.
July 31, 2020 at 4:01 pm #111833Anonymous
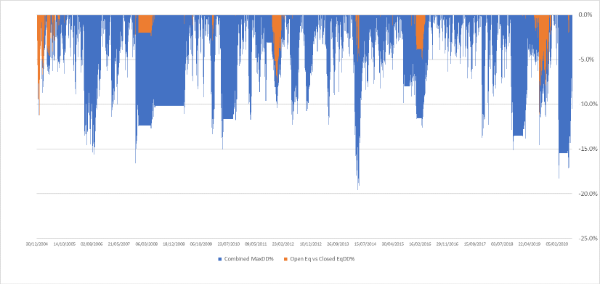
InactiveThe other thing I have been working on is to look at Open Equity performance against Invested Equity or Closed Equity.
I mentioned previously the issue of high Open Equity drawdowns, and how I get scared off seeing say a 30% DD, so have a look at the reasons behind the drawdown.
Charts below show;
a) the Combined Equity Curve for the Weekly & Monthly NDX Rotation (as per above), and the Maximum Closed Equity or Cash Invested level for the combined systems.b) Open Equity DD% and the DD% of Open Equity against Max Closed / Invested Equity
What I wanted to see was the risk to actual invested cash.
It’s a bugger when open equity drops 25% in a few days, but what I wanted to know was the risk of damage to the locked in cash investment.
What this has done is help me see the cash investment risk from a new angle – need to remain very mindful of open equity drawdown risk, but the ultimate risk to my mind, is my cash investment.
What I see from this helps me feel a bit more comfortable.

 July 21, 2021 at 6:11 am #111834
ChrisThong
ParticipantHi All,
Can someone please share the formula to calculate weighted ROC?
July 21, 2021 at 8:07 am #113601GlenPeake
ParticipantHi Chris,
This should hopefully get you started…
There’s probably a million different ways of changing the weighting… but as an example, here’s one approach.
Code:LongTermROCP1 = Param(“Long Term ROC Period”,252,30,260,10);
ShortTermROCP1 = Param(“Short Term ROC Period”,20,10,260,10);ROCYear = ROC(Close,LongTermROCP1);
ROCMonth = ROC(Close,ShortTermROCP1);ROCYearWeight = (ROCYear*2); // Change the multiple for more/less weight e.g. 2
ROCMonthWeight = (ROCMonth*3); // Change the multiple for more/less weight e.g. 3Rank = (ROCYearWeight + ROCMonthWeight);
Also some other variations examples you might want to play with:
Code:/*
Details AFL Formula Prefer Stocks that1. % Above MA200 C/MA(C,200) More stretch away from their MA200
2. 100-% Above MA200 100-C/MA(C,200) Are closest to their MA200
3. 1000 – ROC 1 Month 1000-ROC(C, 21*1) With the worst 1 month return
4. 1000 + ROC 1 Month 1000+ROC(C, 21*1) With the best 1 month return
5. 1000 – ROC 3 Month 1000-ROC(C, 21*3) With the worst 3 month return
6. 1000 + ROC 3 Month 1000+ROC(C, 21*3) With the best 3 month return
7. 1000 – ROC 6 Month 1000-ROC(C, 21*6) With the worst 6 month return
8. 1000 + ROC 6 Month 1000+ROC(C, 21*6) With the best 6 month return
9. ADX(21) ADX(21) Highest 21 period ADX
10. 1000-ADX(21) 1000-ADX(21); Lowest 21 period ADX
11. HV100 StDev(log(C/Ref(C,-1)),100)*(252^.5)*100 Highest 100 day historical volatility
12. 1000-HV100 1000-StDev(log(C/Ref(C,-1)),100)*(252^.5)*100 Lowest 100 day historical volatility
13. HV50 StDev(log(C/Ref(C,-1)),50)*(252^.5)*100 Highest 50 day historical volatility
14. 1000-HV50 1000-StDev(log(C/Ref(C,-1)),50)*(252^.5)*100 Lowest 50 day historical volatility
15. RSI14 RSI(14) Highest 14 period RSI
16. 100-RSI14 100-RSI(14) Lowest 14 period RSI
17. abs(MA(C,50)/MA(C,200)-1) abs(MA(C,50)/MA(C,200)-1) Have their Ma50 furthest from their MA200
18. 100-abs(MA(C,50)/MA(C,200)-1) 100-abs(MA(C,50)/MA(C,200)-1) Have their Ma50 closest to their MA200
*/July 21, 2021 at 10:30 am #113603ChrisThong
ParticipantHi Glen,
Thank you for sharing codes!!
One stupid question, if I may. The code “abs(MA(C,50)/MA(C,200)-1)” May I know why is “-1” in it? I have checked the formula for abs in AB help contents and cannot figure out why “-1” is being used.
July 22, 2021 at 4:58 am #113604GlenPeake
ParticipantGood question Chris!!!

Not sure why the -1 is there….. I obtained/downloaded the list of AFL “as is” from a website somewhere, so I can’t explain that one

I run a comparison using the following code and can’t elaborate further:
ABSCT1 = 100-abs(MA(C,50)/MA(C,200)-1);
ABSCT2 = 100-abs(MA(C,50)/MA(C,200));Filter = 1;
AddColumn(ABSCT1,”Stock ABS-1″,1.8,colorDarkGrey);
AddColumn(ABSCT2,”Stock ABS-2″,1.8,colorDarkGrey);July 23, 2021 at 7:24 am #111835ChrisThong
ParticipantHi All and Michael,
Sorry to hijack your post as I think it is unnecessary to start a new thread for the same topic.
Attached are the stats of the rotational strategy that I am building. Trading universe is ASX 100 with dividend on. Rules are as follows:
1. Position sizing: volatility based using the code from Said.
2. Ranking: ROC * HV (got this idea from Cesar’s blog)
3. Stock’s close > MA
4. Dual index filter such as fast and slow.
5. Test period: 1/1/2005 to 5/7/2021
6. 10 max positions
7. Worst Rank = 20
With the volatility based position sizing the CAR is 8.77% and MDD is 12.77% MAR 0.68
When it comes to % of equity and a reduced max position to 5, I have CAR 19.45% MDD 24.77% MAR 0.79
My questions are as follows:
1. are the above results in the ball park?
2. Can someone please share some idea for reducing the MDD?
3. I was told that Nick rebalances his monthly rotational system every second week or something like. Wouldn’t that be a fortnightly system?
4. Can someone point me to the direction how to rebalance in the month?
Thank you very much.
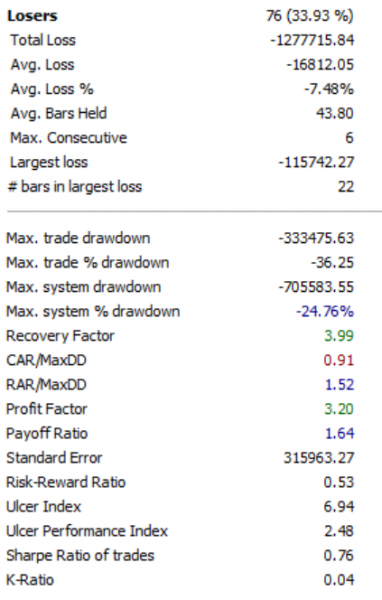
July 23, 2021 at 7:59 am #113612GlenPeake
ParticipantHi Chris,
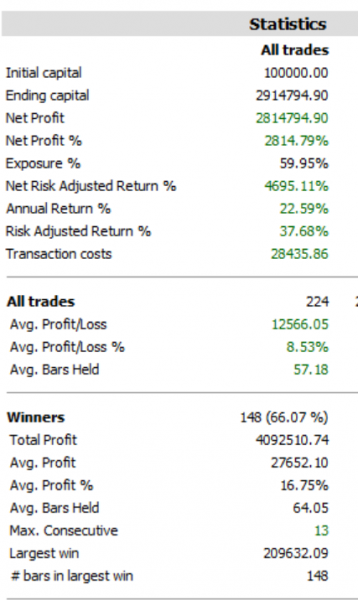
For a comparison, here are my stats. (1/1/2005 to 23/7/2021)
This is without DIVs…
It’s using 5 positions @ 20% per position. This is the same approach that Nick uses for the ASX100 Rotation system on TheChartist website.
-
AuthorPosts
- You must be logged in to reply to this topic.