Home › Forums › Trading System Mentor Course Community › Trading System Brainstorming › Monthly Rotation v2
- This topic is empty.
-
AuthorPosts
-
July 7, 2020 at 9:02 am #102015
Anonymous
InactiveOriginal post was lost at the weekend with the site down.
Re-post (I think) of what I originally put up.
Started a couple of weeks ago in working on developing a Rotational system.
Early days at the moment, but have been through feedback from folks as to what was helping / damaging their development of systems, and from Nick.
Started simple then added complexities – ADX filter / PDI vs MDI / ATR expansion / contraction / RSI direction and vs RSI average. In the Index filter simple MA / MA averages / ROC of the Index (declining / flattening) etc etc ) / alternate ranking methods (simple weighted ROC / Weighted ROC average / ROC / ATR and others).
And, as seems to be the evidence from other folks’ postings, back to simple. Maybe tweaks . secret sauce in the mix, but essentially relatively simple.
Developed on NDX, and trying against ASX 100.
Using 5 positions – copying Nick’s Large Cap momentum.
At this stage, cant get system to work anywhere near as well on S&P 500 / R1000 which makes me wonder do I restart, or keep plugging away using NDX as the basis.
3 Components – Index Filter / Dual ROC weighted for ranking / stock LTMA.
Experimenting with Gap Filter as guided by Nick, which helps on the weekly version, and, once start to use a short period range, helping aspects of Monthly performance
The interesting takeaways at this early stage for me are;
1) Using $SPX as index filter rather than $NDX helps
2) Can $SPX be used as the Index filter on ASX100? Tried system on ASX100 – all params kept the same, and forgot to switch the Index to $xao.au. Performed OK, then switched to using $xao.au and performance fell right off. Sheer fluke, but is it telling me that system not robust against ASX100?
And not getting close to what Glen has shown with the ASX version of his rotation.
3) Tested on Weekly basis, and just about holds up, only adjustment made being to half the periods used for index LTMA – all other parameters left the same.
Makes me question (and so will investigate), if I have to change the filter LTMA, do I also need to adjust the ROC periods etc? But that defeats the “Robust” rule, does it not?
4) Outright performance less important than balance of performance – no good having 2013 produce 100% return, and last 4 years 5% paInitial backtests below and in following post.
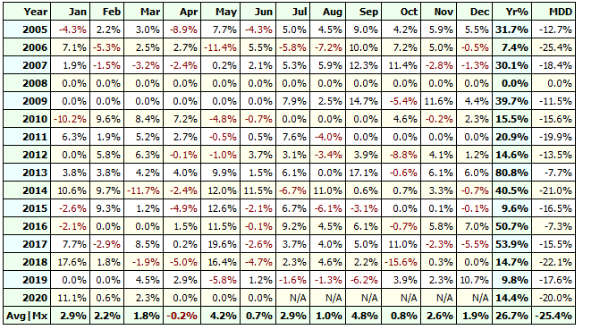
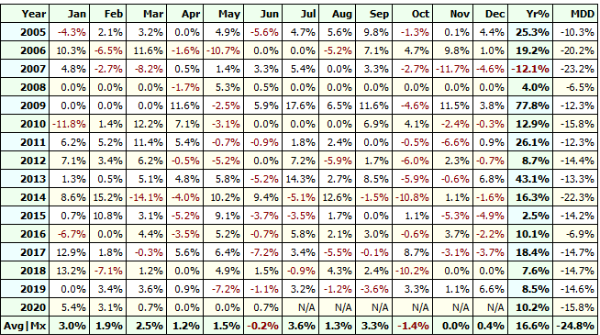
For NDX I show a) NO Exclusions then b) NVDA & MU excluded
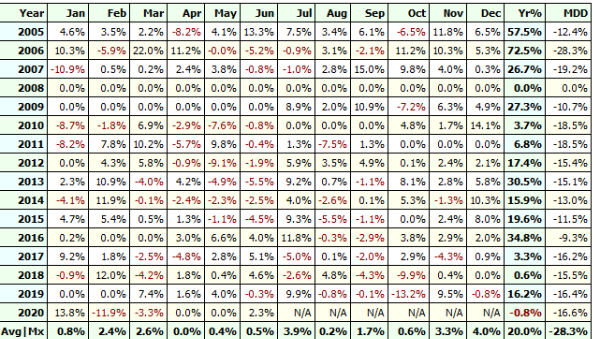
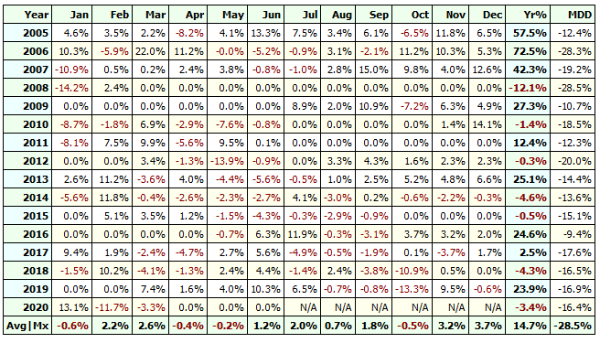
Then for ASX 100 using $SPX as Index, and then $XAO.au as Index
So whilst the initial NDX result (no exclusions) looks good, other results, maybe less so.NDX No exclusions
NDX with NVDA & MU exluded
ASX100 using $SPX as Index Filter
ASX100 using $xao.au as Index Filter
Not a “start again”, but from what I am seeing, more investigation needed.
July 7, 2020 at 9:28 am #111828Anonymous
InactiveThe Backtest for NDX no exclusions and no Gap Filter enclosed.
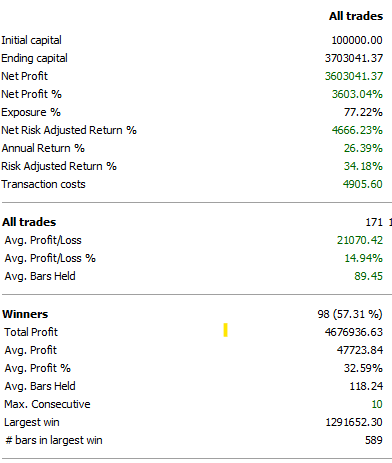
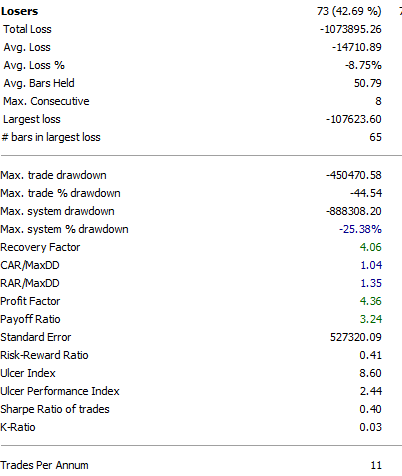
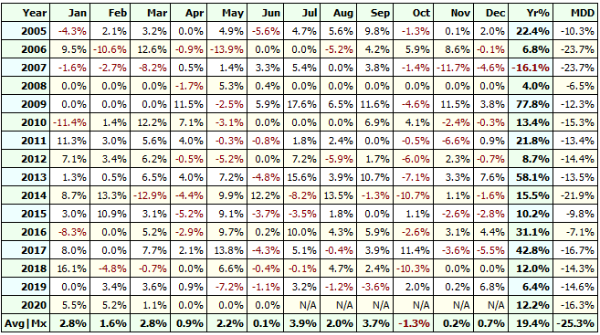
The base version on a weekly basis (NDX only);
Per Glen’s suggestion, I tried the alternate Index Filter (dual MAs) for the ASX 100 – what worked for me was quite short periods.
Following a call with Nick, I am going to focus on the NDX as my universe.
I was getting very concerned that when I tried out on other universes, the performance didn’t match up to the NDX universe.However, results were in positive territory, and the system wasn’t broken. And as Nick told me, all I am wanting to do is to see if it falls over completely, i.e. negative results for multiple years, or at least holds up.
More detailed testing underway on NDX Monthly, then will run weekly basis.
July 7, 2020 at 9:28 am #111829Anonymous
Inactiveremoved as same post ended up being posted twice
July 7, 2020 at 10:19 am #111836JulianCohen
ParticipantTake heart; I have never been able to build a satisfactory ASX program so I kept to NDX.
July 7, 2020 at 6:47 pm #111837Anonymous
InactiveHey Michael – I finished work on an NDX system a few weeks ago and went live on the 1st. I’m trading two monthly tranches; one on the 1st and one on the 15th. I thought about doing a four week rotation, or a ten day rotation, but I think twice a month should be fine.
A few things that I noticed when applying my system to SP500 and R1000:
I only tested these with a weekly system… too many stocks for my taste to run monthly.
Increase the number of positions that you use to 10 or 20
I saw some drawdown reduction by using risk based position sizing
Are you using SetOption(WorstRankHeld)? For the larger universes I saw some benefits by increasing this number quite a bit. https://www.amibroker.com/guide/afl/enablerotationaltrading.htmlMy NDX system didn’t do well on those others, but I did get some decent performance metrics after the above tweaks. All of that being said, though, I’m not going to bother trading it.
CheersJuly 8, 2020 at 1:25 am #111830GlenPeake
ParticipantHi Mike,
Your NDX system is coming along nicely….
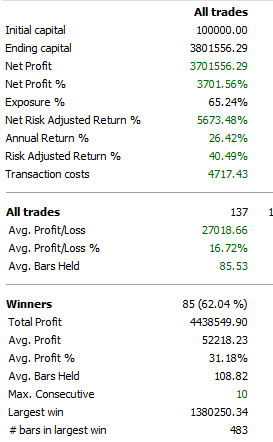
You mentioned above that you have a LTMA on the stock? Is that correct? What do the stats look like if you turn the LTMA off? I don’t run one as it didn’t make much difference on my system, the ROC calculations seem to weed out the garbage etc…. I do have a PDI filter on the stock, which improved DD, maybe try that…
DD -26.79% without PDI filter,
DD -19.88% with the PDI filter.e.g.
PDI Filter…. PDI Period (x) > (y) PDI LevelStats below of my NDX System
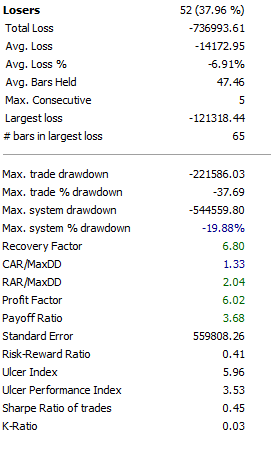
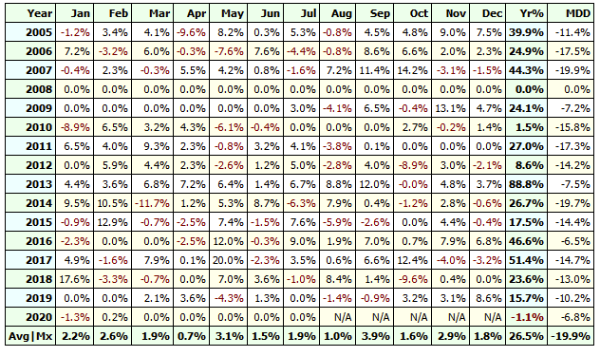
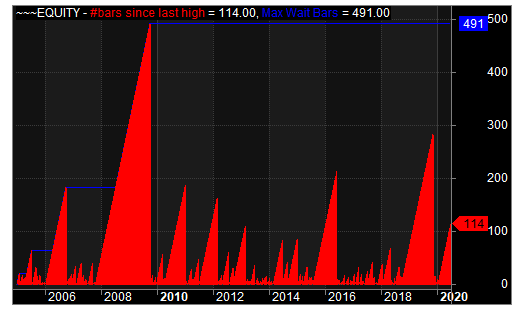 July 8, 2020 at 7:43 am #111831
ScottMcNab
ParticipantMichael Slater wrote:And not getting close to what Glen has shown with the ASX version of his rotation.I think few of us have been able to replicate Glen’s performance regarding rotational systems..all credit to him. This forum is an invaluable source of knowledge but if it has a hidden “hook” it stems from that human temptation to look over the fence and seeing what bbq the neighbour has …and then deciding need to upgrade
Twelve months ago, if anyone had offered you 20%CAGR on US and 15% cagr on AUS for the next decade would you take it? I would. I think your systems look good too. From here it is easy to venture into the minefield that is curve fitting as you try and improve the stats. The other thing to bear in mind is the low number of trades in monthly rotation systems (compared with MOC or MRV) and so periods of under performance may just represent a crappy few years for the ASX rather than any failure of the system.
If I had any concerns it is that the NDX is used as the basis of further comparisons…it obviously contains reasonably “special” companies that have had an amazing couple of decades …..the rock star of momentum trading. In a way, its not at all surprising that the same system is not quite as good when used on other markets…especially when comparing asx results to a system that only picks the top 5 from NDX…setting yourself an almost impossible benchmark perhaps ?
July 8, 2020 at 8:32 am #111841GlenPeake
ParticipantScott McNab wrote:so periods of under performance may just represent a crappy few years for the ASX rather than any failure of the system.Yeah, this actually a really valid point I believe, one that I had considered during the ASX/NDX builds… just comparing the performance of ASX vs NDX since the GFC….. NDX chart is new highs after new highs…. while the ASX…. well… chalk and cheese really.
July 8, 2020 at 9:38 am #111838Anonymous
InactiveThanks Julian – NDX shows promise, and ASX has potential – so feeling positive the system has legs – just need to prod and probe further
July 8, 2020 at 11:07 am #111842Anonymous
InactiveThanks for the feedback and suggestions from everyone.
With regard to building the NDX system, yes, I was extremely excited when very early iteration produced 3,900% net profit from Jan 2005.
But as Scott highlights, with a couple of superstar growth stocks, difficult for me to avoid having them in the backtests with whatever criteria / parameters used.
All my stress testing / optimisation etc, has been done excluding NVDA and MU, and system still seems to hold up.Yes – I am extremely guilty of falling into the trap of comparing what I generate, to what others are creating and producing in term of performance. If I spend my focus and time on that, then I will never set a system in motion.
Nick’s advice to me (and sure he has said this to most here) – just be interested in your own equity curve – is it travelling in the right direction, with the drawdown risks that are suitable for your personal profile and ambitions.
What I am always interested in is identifying ways to improve the risk profile.
An initial suggestion from Nick was to look at implementing a Gap Filter. When I applied, performance fell away, and so I dismissed the idea.
However, when I revisited the gap filter, and investigated the criteria a bit more i.e. length of Gap lookback / % change in Gap, the risk profile and consistency improved.
More noticeable in some of my stress testing / WFA work.
As a comparison, the NDX with NO Gap Filter and NVDA/MU excluded shown below, compared to NDX WITH Gap Filter, and NVDA/MU excluded.
Glen – thanks for the LTMA and PDI suggestions .
Seth – in testing I am using 5 positions / 10 Worst Rank. Always interesting how natural inclination is to make worst rank same as max positions, but time and again, leaving room to breathe works better. I guess the comparison is that systems using a trailing stop, larger the stop, the longer you stay in the trend.
Back to it.
NDX with NO Gap Filter
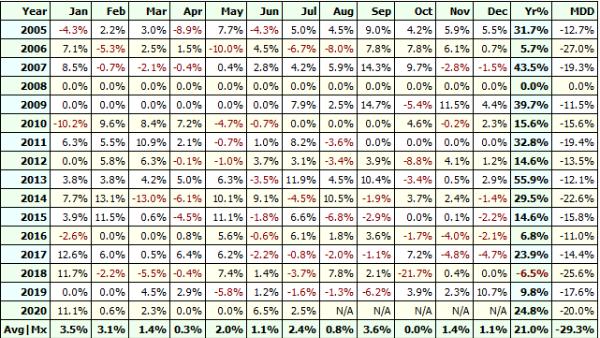
NDX WITH Gap Filter
Cheers
July 8, 2020 at 12:15 pm #111843Howard Lask
ParticipantThanks all for the interesting discussion. Quick point of clarification… does PDI stand for Positive Directional Indicator as used as a component of the ADX?
Cheers
July 8, 2020 at 12:42 pm #111844Anonymous
InactiveYes, PDI you may also have seen as DI+ (MDI is DI-).
July 8, 2020 at 1:22 pm #111845Anonymous
InactiveOne Robustness test I have done is to vary the Entry date from 0 days up to 25 days, to check on impact (also varies the Exit date by the same amount).
Earlier days (i.e 0 –
 are better, but even delaying by a whole 4 / 5 weeks doesn’t break the system (almost, but not quite).
Shown graphs using With Gap Filter and No Gap Filter. Again, all excluding NVDA / MU
2005 – 2015

2015 – 2020
 July 10, 2020 at 1:27 pm #111846
Anonymous
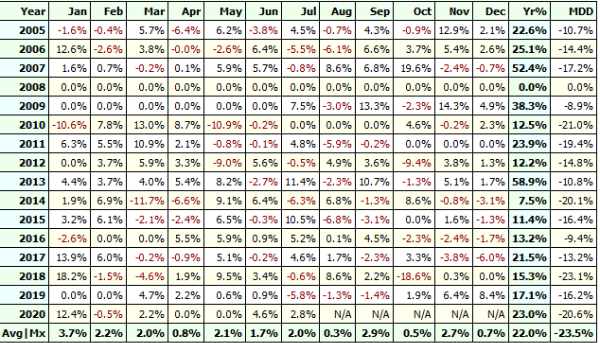
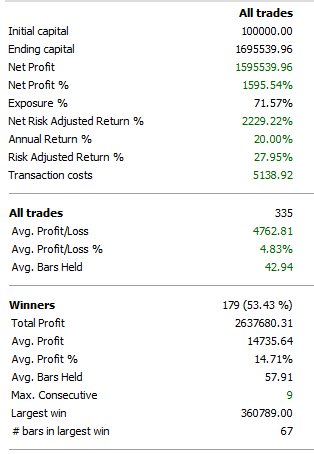
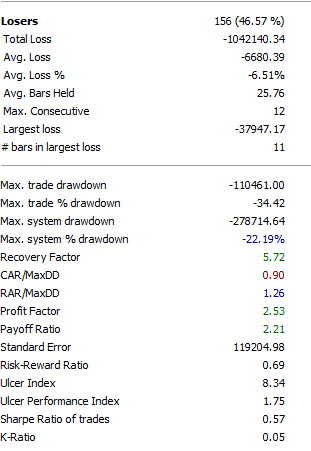
InactiveAs a continuation of the process I am looking at the Weekly version of the NDX rotation, with a view to combining with Monthly.
Backtest details as shown have exact same parameter settings as Monthly, apart from Index filter set at 100 days as opposed to 200 days for Monthly. Gap Filter ON / NVDA & MU Excluded.
Thing that stands out is the low Avg Profit % per trade at 4.83%.
This compares to the Avg Profit % of 10.9% for the monthly 2005 – to date (excl NVDA MU) [ with NVDA & MU included, Avg% hits 14.3%]Optimisation / Robustness testing underway.
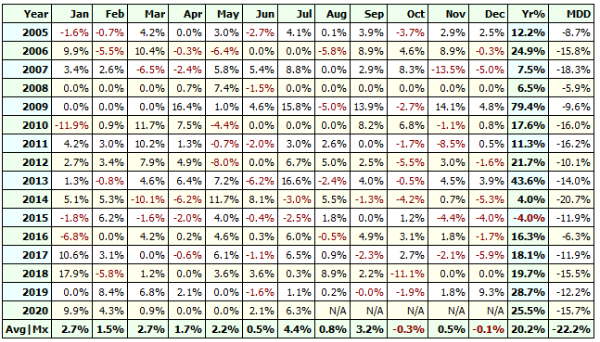
As an initial check, I have done a consolidation of Monthly and Weekly to see the impact of combing – outputs in next post.
 July 10, 2020 at 2:21 pm #111850
Anonymous
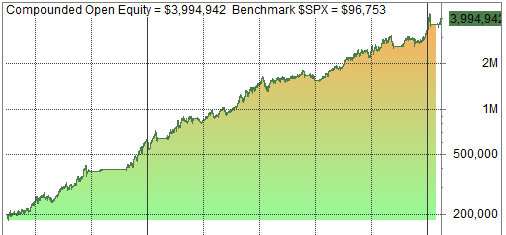
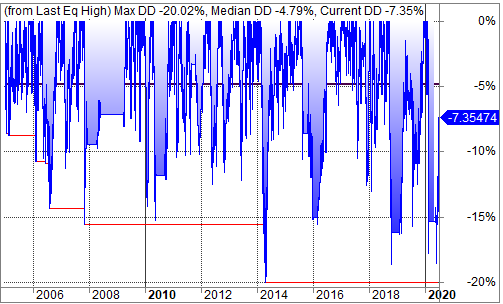
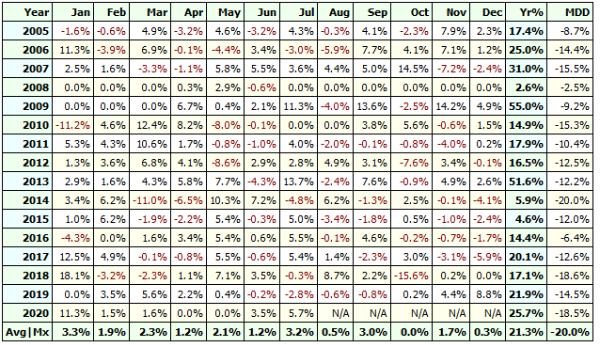
InactiveMy efforts at combining Weekly and Monthly;
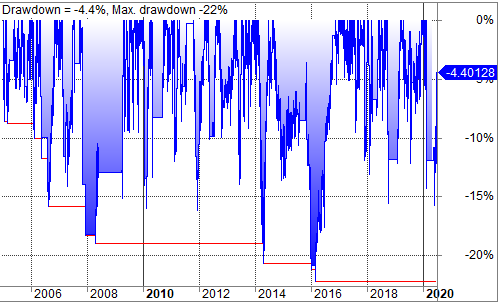
To my eye, the combined Drawdown does “soften” the Monthly DD chart.
COmbined Equity (exl NVDA MU) 2005 – to date
Combined Equity DD
Combined Monthly Profit Table
Monthly standalone DD
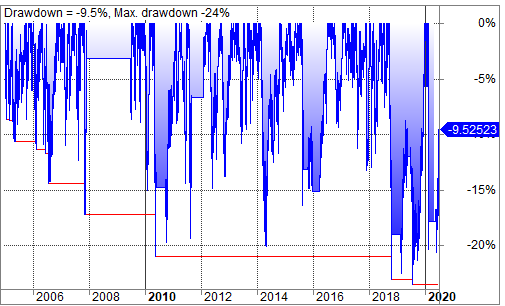
Weekly Standalone DD
-
AuthorPosts
- You must be logged in to reply to this topic.