Forums › Trading System Mentor Course Community › Performance Metrics & Brag Mat › Mean Reversion on Different Universes
- This topic is empty.
-
AuthorPosts
-
June 13, 2024 at 1:48 pm #102282
RobertKinnell
ParticipantI’ve built a few systems using mean reversion on the Russell constituents (R1000, R2000, R3000) and have been exploring other universes to see how they differ. The differences are interesting.
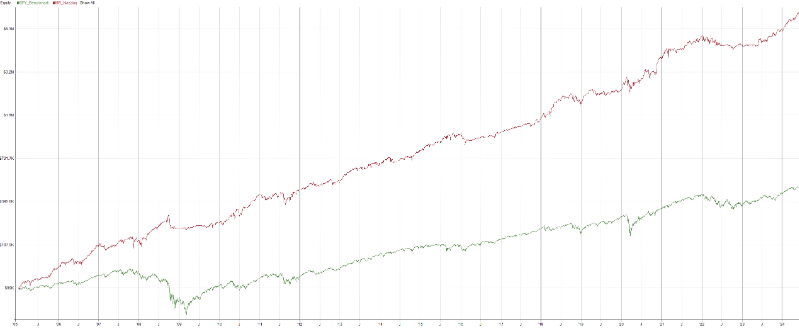
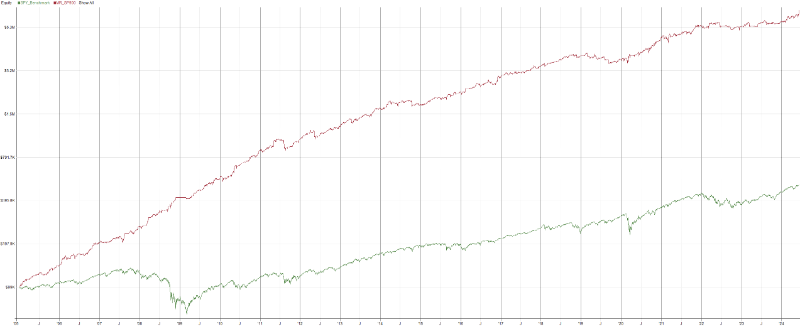
So far, on the SP900 and Nasdaq I’ve found that a smaller number of MaxPos work better (i.e. 5) vs 10 to 20 on the Russell. On the Nasdaq, using a stretch off the prior close is better than a stretch off the prior low and a very simple price based pullback rather than an indicator or formula.
I have also found combining this Nasdaq mean reversion with my Nasdaq monthly momentum system doesn’t improve the results or reduce the MaxDD.

 June 20, 2024 at 9:00 am #116182
RobertKinnell
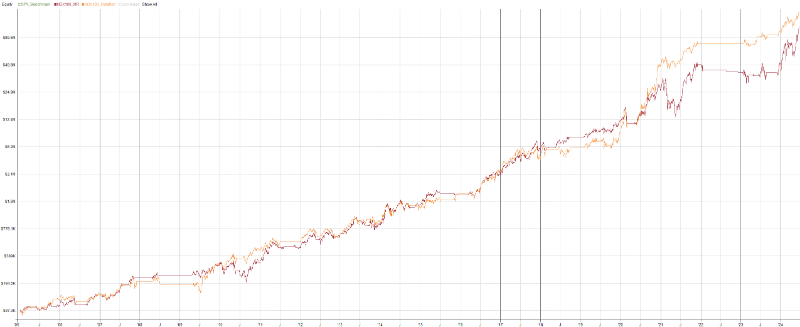
ParticipantHere is a mean reversion system which targets the top momentum stocks in the NDX. Essentially, a combination of a momentum system and a mean reversion system with daily entry/exits. The idea came from: https://www.systematic-investors.com/strategy-session-ndx-momentum/ which had a CAGR of 35% and 23.5% MaxDD.
My attempt:

Compared to a regular monthly momo NDX system, very highly correlated (not surprisingly):
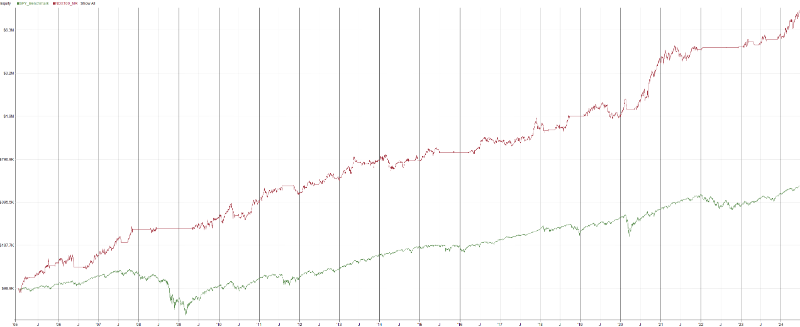
And a version for the Russ1000:

 June 20, 2024 at 10:06 pm #116183
Nick Radge
KeymasterLooks very promising.
June 21, 2024 at 2:55 pm #116184RobertKinnell
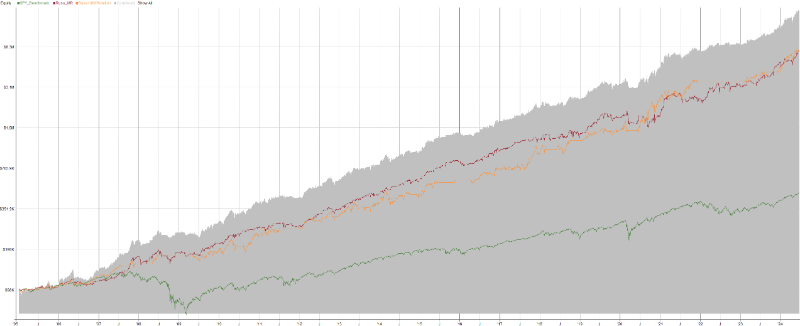
ParticipantThe Russ1000 system above refined further to 28% ROR and 30% MaxDD. Adding it to a monthly rotational system keeps the ROR around the same but decreases the MaxDD by 10%.

 November 19, 2024 at 4:26 pm #116185
Nick Radge
KeymasterI’m just doing some work for a client who trades 2x MOC systems. These both trade the full US market and have been pretty average the last 18 months.
I took a look at the same systems but just on the R-1000 universe. Obviously not as profitable, but also no dip in equity over the last 18-months and consistently trend upwqrd equity growth.
Anyone noticed the same?
November 21, 2024 at 5:37 am #116383GlenPeake
ParticipantHi Nick,
As a comparison (not sure if this helps), here are a suite of 9x MOC systems (using shared equity) each system starts with $100K so total start equity is $900K
All systems are LONG only and trade R1000. Therefore HIGH Correlation between all systems as all are LONG R1000 etc….haven’t tested this suite of MOCs vs entire US Full Market…. but suspect more volatility etc (keeping in mind there are NO Volume/Turnover filters in any of these systems, as they are for R1000 etc…..
2023 was definitely the ‘leanest’ period for the systems….. circa 5% return
Stats attached 2015-2024 period TEST# 278 (top line yellow highlight)
Individual Years between 2015-2024: TEST# 268-277 (middle section within RED BOX)
2015-2019 vs 2022-2024 TEST# 266-267 (bottom 2 lines yellow highlight)I designed the systems a few years ago…. and there has been ZERO re-calibration, haven’t re-touched the parameters since etc…… (Not trading these systems LIVE, just decided to experiment and design some MOC systems etc…..but all are pretty simple and robust imo and the fact that they’ve performed OK over the past 2 years, yeah sure it’s been a ‘lean’ period etc, but in general I think that’s just been the market behaviour during that time and the systems being slightly out of sync etc)
 November 21, 2024 at 9:38 am #116385
Nick Radge
KeymasterThanks. the R1000 seems to chugging along nicely. Its those that trade the full US universe, i.e. the impact outside of R1000 stocks.
November 22, 2024 at 8:08 am #116386GlenPeake
ParticipantHere’s a sample of 2x MOC systems using Minimum $10million Turnover Filter against All US using the InMEL constituency ($MEL)
I had to cut it back to just 2x MOC systems from 9x Systems due to memory limitations….
Year by Year breakdown…….. (Test# 3-12)
2015-2024 (Test# 2)
 November 23, 2024 at 5:18 pm #116387
Nick Radge
Keymastermmm..okay. Good to know. Thanks Glen. Appreciate you taking the time to knock that data out.
November 24, 2024 at 8:28 am #116388GlenPeake
ParticipantAnd just for completeness and a like for like comparison, here’s the same 2x MOC systems from my previous post, this time against the R1000 only. (No turnover filter here etc)
 November 27, 2024 at 10:08 pm #116384
ScottMcNab
ParticipantAlthough not directly applicable, my MRV shows a similar pattern…RUI equity curve smoother (but shallower) rise while USA shows sig dip in 2022 and flat 2023 (as does RUA but to a lesser extent). The shape of the curve with USA varies so much however depending on how I filter liquidity (volume/price/shares under 1% of total volume) and limit extra setting selected (starting to use 0.05 when using total USA now). It would be too good to be true I guess if simply dividing each MOC system into 2 subsystems that defined the liquidity selection criteria differently combined to produce a smoother curve without having to change anything else
-
AuthorPosts
- You must be logged in to reply to this topic.