Forums › Trading System Mentor Course Community › Trading System Brainstorming › Mean Reversion – June 2022
- This topic is empty.
-
AuthorPosts
-
July 6, 2022 at 11:31 pm #114909
Nick Radge
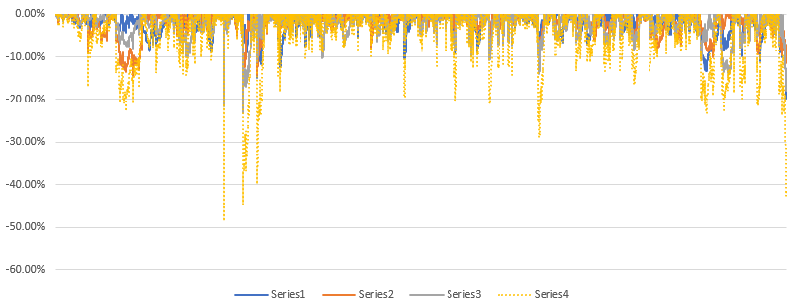
KeymasterUpdate to my prior post. I adjusted my stretch for Setup #2 from 0.75 to 1.0. The MAR ratio lifted from 1.51 to 2.45. The combination of all 3 setups together saw a slight reduction in maxDD but pushed the MAR from 2.76 to 2.91. You can see the difference with this underwater chart.
 July 6, 2022 at 11:35 pm #114919
TerryDunne
ParticipantHi Nick,
Just so I don’t misunderstand…you’ve adjusted your stretch from .75 of ATR to 2 times ATR?
Regards,
Terry
July 6, 2022 at 11:49 pm #114920Nick Radge
KeymasterSorry – typo. Should be 1.0 which has now been edited.
July 7, 2022 at 1:35 am #114921TerryDunne
Participant July 8, 2022 at 1:38 am #114882
BenOsborn
ParticipantHi all,
When going back to the early 90’s my MOC systems were getting creamed (underwater for years). After going back to the drawing board and testing a few other ideas for MOC systems I started to look into the results further. I noticed that there were a few anomalies that appeared to be the main cause of the crappy results.
I had trades where there was a gain in price but the result was a significant loss. For example, I had one where the price ended up flat for the day yet I had a 350% loss. Another where there was a 10% gain in price but the result was a 30% loss. Looking closer, the reason for the loss was the commission.
There were two reasons for this. 1. The prices of some stocks were very low (e.g. $0.005) so I was buying a shitload of shares and 2. I have my commission set higher as I’m using TradeStation and not IB ($0.01 vs $0.005), so this just compounds the issue.Looking further into the results I noticed a lot of shares were below the $10 minimum in my settings, especially back in the 90’s. This meant that I was buying a lot of shares of some stocks, leading to very high commission charges.
After speaking with Craig, he advised that the test is being run on adjusted data but referencing unadjusted close if using a price filter on that setting. Therefore, any backtest metrics are calculated on the adjusted data.The following is an example of a more recent stock that I was able to find the unadjusted price for. The effect of this is not as pronounced as in the early 90’s where some shares were trading for just cents.
For example, my system has a $10 price minimum. It bought CTRA on 29/4/2005. On my chart and in the backtest it shows the price as $3.40. This was because it is the adjusted data.
However, it was included as the unadjusted price was about $30 in April 2005, which is higher than my $10 price minimum. So if I had of run my exploration after the market close on 28/4/2005 the real price then would have been around $30 and not $3.4.
This means that in my backtest I am buying 10 times the number of shares than I otherwise would have at the time. I have now excluded the share that was causing a couple of 350% losses and changed my commission to 0.005 and it is giving me a better representation.
Just a heads up for those like me that hadn’t really thought about this. Also shows some of the effects a higher commission can have.
July 8, 2022 at 1:42 am #114923KateMoloney
ParticipantGreat insight Ben
July 8, 2022 at 12:54 pm #114924TimothyStrickland
ParticipantThanks Ben, I keep commissions in the back of my mind but I think I need to take a closer look at this to make sure things are priced right in my back test.
July 9, 2022 at 11:17 am #114886BenOsborn
ParticipantI have been playing with a short MOC system to try and diversify and have run into similar issues.
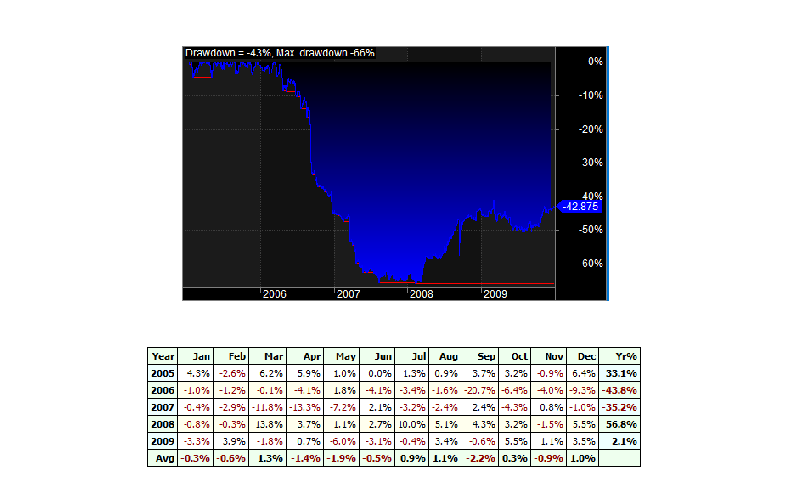
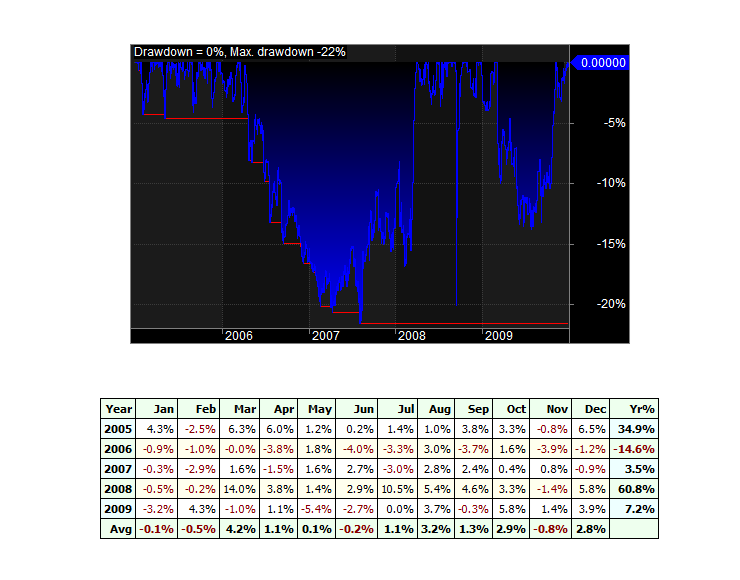
I have attached two files to try and highlight the difference. The first backtest uses a commission of $0.005 per share. The second uses a flat commission of $3 per trade. This is the only difference.
The first has a CAGR of -4.44% and a Max DD of -65.77%. You can see from the screenshot it is underwater for a the last couple of years The second has a CAGR of 16.19% and a Max DD of -21.55%.
I have only limited it to a few years as once the account grows a $3 flat commission isn’t going to be realistic.
Most of the damage is done by one stock which has an adjusted price of 2 cents (so the system is buying a shitload of shares resulting in a huge commission) and is traded around 20 times.
 July 9, 2022 at 11:18 am #114928
BenOsborn
ParticipantDoesn’t look like the second file is showing so here it is.
 July 9, 2022 at 12:36 pm #114887
GlenPeake
ParticipantI don’t trade a MOC system atm, but thought I’d play around with some of the more recent declines in the market to test a new idea out.
In a nutshell, use normal position size when the PDI > MDI against the $SPX and half the position size when MDI > PDI
Normal Position Size all the Time

Half Position Size when $SPX MDI > PDI

For those that use RealTest here is the code:
////////////////////////////////////////////////////////////////////////////////////////////////////////////////
//////////// DATA Section
// PDI Index Regime Filter
PDIIndex1: PDI(5)
PDIIndexSPX: Extern($$SPX, PDIIndex1)
// MDI Index Regime Filter
MDIIndex1: MDI(5)
MDIIndexSPX: Extern($$SPX, MDIIndex1)
PDIMDIIndexCompare: PDIIndexSPX > MDIIndexSPX//////////// STRATEGY Section
// Use Half Position Size
Quantity: if(PDIMDIIndexCompare, (PCTQTY), (PCTQTY)/2)
////////////////////////////////////////////////////////////////////////////////////////////////////////////////It reduces DD over recent periods, but also reduces CAR over a longer backtest period……another rabbit hole to go down for those that want to experiment a little.
July 17, 2022 at 4:02 am #114929GlenPeake
ParticipantExperimenting continues….. this time I’ve tried testing adjusting the Stretch based on the PDI/MDI of the $SPX…..This is again on the MOC system which I’m not trading atm. (Normal position sizing for both conditions).
i.e. When PDI > MDI (Normal Stretch)
When MDI > PDI (Increase Stretch)2005-2022 (15/7/22)

Upper result is with the PDI/MDI Stretch Increase enhancement.
Lower result is just normal stretch.Another rabbit hole for those that want to see how it works on their systems.

RealTest Code below
////////////////////////////////////////////////////////////////////////////////////////////////////////////////
//////////// DATA Section
// PDI Index Regime Filter
PDIIndex1: PDI(5)
PDIIndexSPX: Extern($$SPX, PDIIndex1)
// MDI Index Regime Filter
MDIIndex1: MDI(5)
MDIIndexSPX: Extern($$SPX, MDIIndex1)
PDIMDIIndexCompare: PDIIndexSPX > MDIIndexSPXATRStretch: ATR(ATRPeriod1)
StretchCalc: if(PDIMDIIndexCompare,ATRMulti1,ATRMulti2)
BuyLim: Round(L – StretchCalc*ATRStretch, 0.01)///////////////////////////////////////////////////////////////////////////////////////////////////////////////////
July 17, 2022 at 10:14 am #114946TerryDunne
ParticipantHi Glen,
That’s a really interesting idea that I will fool around with for sure

For the sake of completeness (and my fixation with large stretches), would you mind posting the performance where you use the increased stretch all the time?
Thanks in advance,
Terry
July 17, 2022 at 10:40 am #114949GlenPeake
ParticipantTerry Dunne post=13231 userid=719 wrote:For the sake of completeness (and my fixation with large stretches), would you mind posting the performance where you use the increased stretch all the time?Yep…. sure thing Terry…. Here it is.

FWIW, the increased stretch value I have set, is exactly double my normal stretch value for this system.
All 3 variations compared below:
#1. Increased stretch 100% of the time.
#2. Hybrid dynamic $SPX PDI/MDI Normal/Increased Stretch.
#3. Normal stretch 100% of the time.
July 17, 2022 at 12:11 pm #114950TerryDunne
ParticipantThanks for that Glen, that’s really interesting. I expect that I’m going to one of those people chained to my computer for the next few days…
Best wishes,
Terry
July 18, 2022 at 5:37 am #114951JulianCohen
ParticipantNice Glen.
I just tried it and it cut the CAGR back as much as the MDD for me so I’m relatively satisfied with the same stretch across all markets.
BTW in RT you can really simplify that code:
SPXFilter: Extern($$SPX, PDI(5)) > Extern($$SPX, MDI(5))
I did try this test in RT which is really interesting. I compared the volatility of returns with my MOC against the volatility of returns with the SPY….It wasn’t what I expected, especially since 2020. The strategy has been much more volatile this past couple of years, especially when compared to SPY.
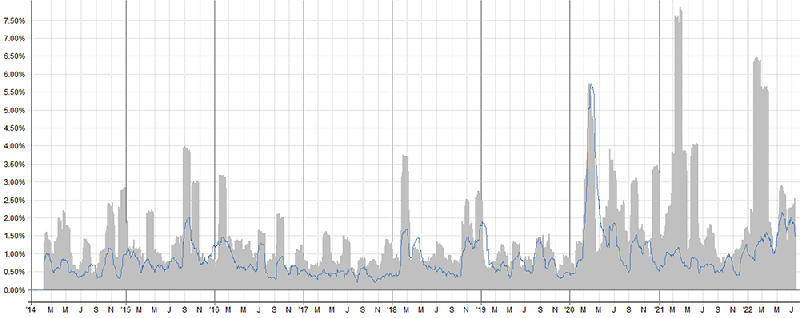
To compare this is from 2004 to 2014
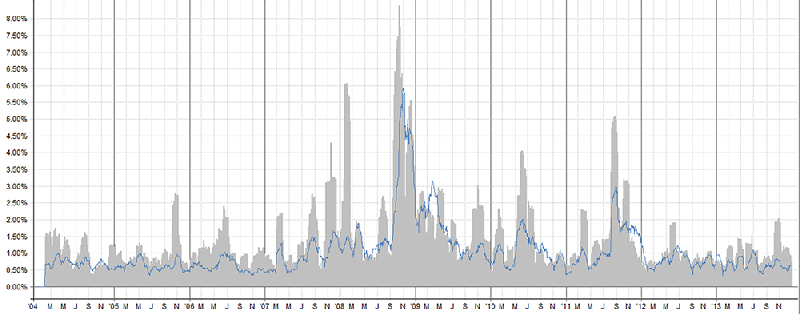
Again a deviation between portfolio and SPY around 2007-2008 and then back in step again.
I’m not reading too much into this, but it’s an interesting thing to look at.
To see this in RT edit the Graph Formulas in graphs.csv and add
Volatility: {%2^} stddev(S.NetPct,20)
-
AuthorPosts
- You must be logged in to reply to this topic.