Forums › Trading System Mentor Course Community › AmiBroker Coding and AFL › Guppy MMA Coding
- This topic is empty.
-
AuthorPosts
-
January 20, 2016 at 6:19 am #101396
Anonymous
InactiveHi Craig,
I am a little stuck on the GuppyMMA task. I was trying to group the Fast EMAs under a single identifier, so that the colour and style parameters are changed at the group level. I have posted my code so far. Currently, It is only displaying 1 of the EMAs. Any hints?
Thanks
Oliver
//MY GuppyMMA Coding Project
_SECTION_BEGIN(“GuppyEMAFast”);EM1 = EMA(C,3);
EM2 = EMA(C,5);
EM3 = EMA(C, ;
;
EM4 = EMA(C,10);
EM5 = EMA(C,12);
EM6 = EMA(C,15);// I am trying to group all the Fast EMAs under the 1 name, so that the colour and style settings apply to the group
GuppyEMAFast = (EM1);
Plot(GuppyEMAFast,”GuppyEMAFast”,ParamColor(“Colour”,colorAqua),ParamStyle(“Style”,styleLine,maskAll));
_SECTION_END ();_SECTION_BEGIN(“GuppyEMASlow”);
EM7 = EMA(C,30);
EM8 = EMA(C,35);
EM9 = EMA(C,40);
EM10 = EMA(C,45);
EM11 = EMA(C,50);
EM12 = EMA(C,55);
EM12 = EMA(C,60);GuppyEMASlow = (EM7);
Plot(GuppyEMASlow,”GuppyEMASlow”,ParamColor(“Colour”,colorDarkRed),ParamStyle(“Style”,styleLine,maskAll));
_SECTION_END ();January 20, 2016 at 6:41 am #102413Stephen James
MemberYou won’t be able to group the EMA’s but colour an style is a different matter
Code:SetChartOptions(0, chartShowArrows | chartShowDates);FastMAColor = ParamColor(“Fast Group MA Color”, colorGreen);
SlowMAColor = ParamColor(“Slow Group MA Color”, colorRed);Plot(EMA(C, 3), _DEFAULT_NAME(), FastMAColor, styleLine);
Plot(EMA(C, 5), _DEFAULT_NAME(), FastMAColor, styleLine);
Plot(EMA(C, 8), _DEFAULT_NAME(), FastMAColor, styleLine);
Plot(EMA(C, 10), _DEFAULT_NAME(), FastMAColor, styleLine);
Plot(EMA(C, 12), _DEFAULT_NAME(), FastMAColor, styleLine);
Plot(EMA(C, 15), _DEFAULT_NAME(), FastMAColor, styleLine);Plot(EMA(C, 30), _DEFAULT_NAME(), SlowMAColor, styleLine);
Plot(EMA(C, 35), _DEFAULT_NAME(), SlowMAColor, styleLine);
Plot(EMA(C, 40), _DEFAULT_NAME(), SlowMAColor, styleLine);
Plot(EMA(C, 45), _DEFAULT_NAME(), SlowMAColor, styleLine);
Plot(EMA(C, 50), _DEFAULT_NAME(), SlowMAColor, styleLine);
Plot(EMA(C, 60), _DEFAULT_NAME(), SlowMAColor, styleLine);January 27, 2016 at 3:42 pm #102418LeeDanello
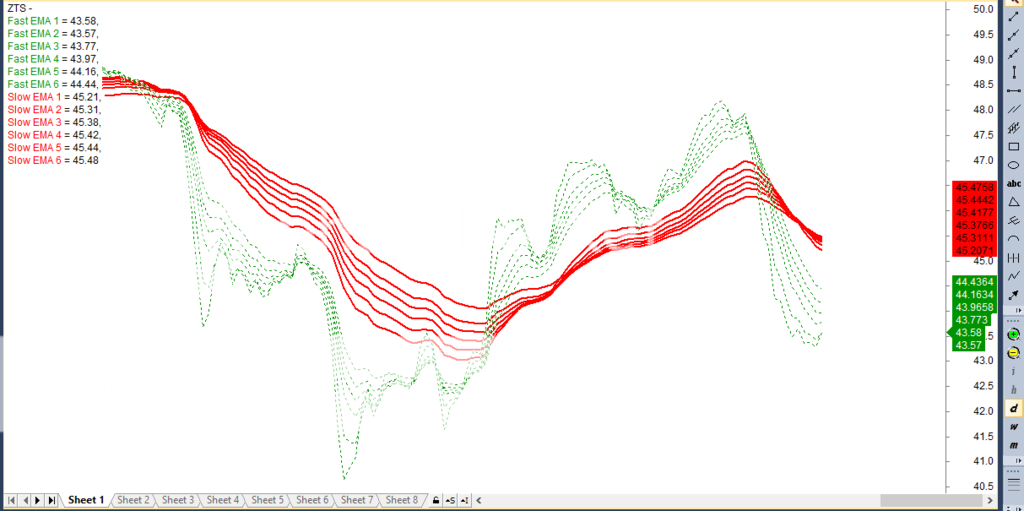
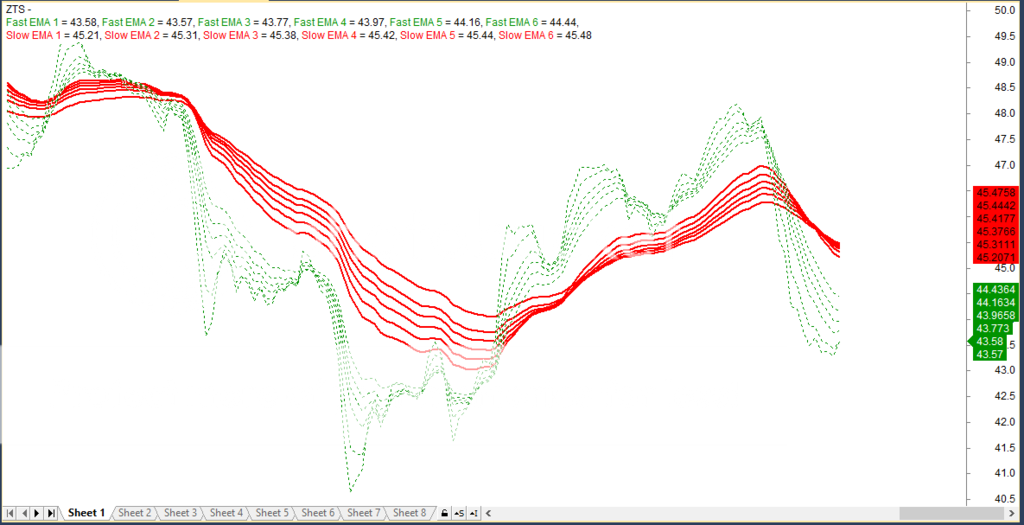
ParticipantDoes anyone what the code is to show the values of the moving averages stacked below each other in the chart pane. That is rather than the default of reading across the top of the chart left to right, how can we code it so the values of the MAs are stacked on top of each other from fasted to slowest
 January 27, 2016 at 9:09 pm #102596
SaidBitar
Memberyou need to add n before the name of the Indicator in the plot function
each n means new line so if you want to put each on a new line you need to addn for each EMA like the code bellow if you want to put the fast group all of them on one new line and the slow group all on another new line you need to add n for the first plot of the fast group and the first plot in the slow group
like thisCode://Plot Fast Group
Plot(FEMA1, “nFast EMA 1”, FastGroupColor, FastGroupStyle);
Plot(FEMA2, “nFast EMA 2”, FastGroupColor, FastGroupStyle);
Plot(FEMA3, “nFast EMA 3”, FastGroupColor, FastGroupStyle);
Plot(FEMA4, “nFast EMA 4”, FastGroupColor, FastGroupStyle);
Plot(FEMA5, “nFast EMA 5”, FastGroupColor, FastGroupStyle);
Plot(FEMA6, “nFast EMA 6”, FastGroupColor, FastGroupStyle);//Plot Slow Group
Plot(SEMA1, “nSlow EMA 1”, SlowGroupColor, SlowGroupStyle);
Plot(SEMA2, “nSlow EMA 2”, SlowGroupColor, SlowGroupStyle);
Plot(SEMA3, “nSlow EMA 3”, SlowGroupColor, SlowGroupStyle);
Plot(SEMA4, “nSlow EMA 4”, SlowGroupColor, SlowGroupStyle);
Plot(SEMA5, “nSlow EMA 5”, SlowGroupColor, SlowGroupStyle);
Plot(SEMA6, “nSlow EMA 6”, SlowGroupColor, SlowGroupStyle); January 27, 2016 at 9:19 pm #102597
SaidBitar
Memberhere is the second option
Code://Plot Fast Group
Plot(FEMA1, “nFast EMA 1”, FastGroupColor, FastGroupStyle);
Plot(FEMA2, “Fast EMA 2”, FastGroupColor, FastGroupStyle);
Plot(FEMA3, “Fast EMA 3”, FastGroupColor, FastGroupStyle);
Plot(FEMA4, “Fast EMA 4”, FastGroupColor, FastGroupStyle);
Plot(FEMA5, “Fast EMA 5”, FastGroupColor, FastGroupStyle);
Plot(FEMA6, “Fast EMA 6”, FastGroupColor, FastGroupStyle);//Plot Slow Group
Plot(SEMA1, “nSlow EMA 1”, SlowGroupColor, SlowGroupStyle);
Plot(SEMA2, “Slow EMA 2”, SlowGroupColor, SlowGroupStyle);
Plot(SEMA3, “Slow EMA 3”, SlowGroupColor, SlowGroupStyle);
Plot(SEMA4, “Slow EMA 4”, SlowGroupColor, SlowGroupStyle);
Plot(SEMA5, “Slow EMA 5”, SlowGroupColor, SlowGroupStyle);
Plot(SEMA6, “Slow EMA 6”, SlowGroupColor, SlowGroupStyle); January 27, 2016 at 11:51 pm #102598
LeeDanello
ParticipantThanks. Didn’t think it was that easy
March 28, 2016 at 1:42 am #102604CAIHuang
MemberHey,
I started the course last week so I am still at the earlier stages. I am trying to code the GuppyMMA ATM and this code I am plotting is coming out a little weird. It shows in Amibroker on my chart as red dashed lines. When I edit the parameters to change the colours or line types it also plays up. For example I click the make it a dashed line (the default is thick) and it changes the colour to Aqua. I click to change it to a hidden line and it changes the colour to dark red etc. It does all sorts of weird stuff when I change the colours in the edit parameters section too. Not sure why this is and would love someone to help and identify the problem if possible.
Cheers
Luke
March 28, 2016 at 1:43 am #103460CAIHuang
Member//MY GuppyMMA
_SECTION_BEGIN(“Fast EMA – Parameters”);
F1 = EMA ( Close, Param ( “EMA 1”, 3 ) );
F2 = EMA ( Close, Param ( “EMA 2”, 5 ) );
F3 = EMA ( Close, Param ( “EMA 3”, 8 ) );
F4 = EMA ( Close, Param ( “EMA 4”, 10 ) );
F5 = EMA ( Close, Param ( “EMA 5”, 12 ) );
F6 = EMA ( Close, Param ( “EMA 6”, 15 ) );
_SECTION_END();_SECTION_BEGIN(“Slow EMA – Parameters”);
S1 = EMA ( Close, Param ( “EMA 7”, 30) );
S2 = EMA ( Close, Param ( “EMA 8”, 35 ) );
S3 = EMA ( Close, Param ( “EMA 9”, 40 ) );
S4 = EMA ( Close, Param ( “EMA 10”, 45 ) );
S5 = EMA ( Close, Param ( “EMA 11”, 50 ) );
S6 = EMA ( Close, Param ( “EMA 12”, 60 ) );
_SECTION_END();//===========================
_SECTION_BEGIN(“Styles”);
Style1 = ParamStyle( “Fast EMA”, styleThick );
Style2 = ParamStyle( “Slow EMA”, styleThick );
_SECTION_END();_SECTION_BEGIN(“Colors”);
Color1 = ParamColor( “Fast EMA”, colorBlue );
Color2 = ParamColor( “Slow EMA”, colorBlack );
_SECTION_END();//===========================
_SECTION_BEGIN(“Styles”);
Plot ( F1, “EMA 1”, Style1, Color1 );
Plot ( F2, “EMA 2”, Style1, Color1 );
Plot ( F3, “EMA 3”, Style1, Color1 );
Plot ( F4, “EMA 4”, Style1, Color1 );
Plot ( F5, “EMA 5”, Style1, Color1 );
Plot ( F6, “EMA 6”, Style1, Color1 );
Plot ( S1, “EMA 7”, Style2, Color2 );
Plot ( S2, “EMA 8”, Style2, Color2 );
Plot ( S3, “EMA 9”, Style2, Color2 );
Plot ( S4, “EMA 10”, Style2, Color2 );
Plot ( S5, “EMA 11”, Style2, Color2 );
Plot ( S6, “EMA 12”, Style2, Color2 );
_SECTION_END();March 28, 2016 at 2:23 am #102414TrentRothall
ParticipantHi Luke,
I think it is because you have the colour and style arrays around the wrong way in the plot code.
your code is – Plot ( F1, “EMA 1”, Style1, Color1 );
the actual plot code is – Plot(Array, “Name”, Color, Style);
so swap the color and style arrays
Trent
March 28, 2016 at 2:29 am #103461CAIHuang
MemberThanks for the reply TrenRoth,
I have made the change and it doesn’t seem to have any effect on the way the MMA is displayed in amibroker.
March 28, 2016 at 3:41 am #102415TrentRothall
ParticipantOhok it worked for me, what does your code look like now?
March 28, 2016 at 8:49 am #103462CAIHuang
MemberYeah I just checked it again then and it is all fine.
Thanks for your assistance mate.April 1, 2016 at 5:53 am #102416LeeDanello
ParticipantJust wondering who in their right mind would use Guppy Multiple Moving averages. I understand that someone else came up with the concept but he’s the one taking all the credit. Sorry but I don’t think much of him. By the way all the nics are gone. Is the aim for more transparency?
April 1, 2016 at 8:49 am #102417Nick Radge
Keymasterlol.
April 3, 2016 at 10:28 am #103486JulianCohen
ParticipantHi guys,
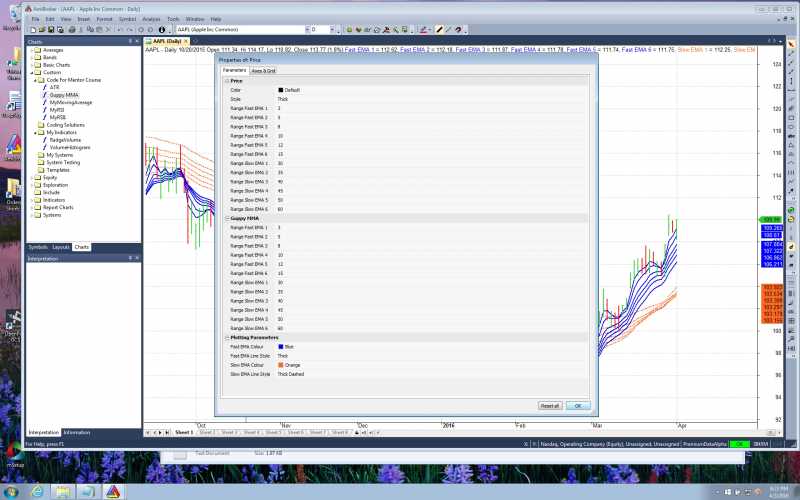
Any idea why my Guppy MMA properties are showing on the chart parameters under price as well as under their own section please?

-
AuthorPosts
- You must be logged in to reply to this topic.