Home › Forums › Trading System Mentor Course Community › Trading System Brainstorming › ETF Strategies
- This topic is empty.
-
AuthorPosts
-
September 12, 2017 at 12:22 am #101697
Nick Radge
KeymasterI’m getting numerous queries on ETF style strategies so I thought I’d post a few systems/ideas that I have come across.
September 12, 2017 at 12:25 am #107644Nick Radge
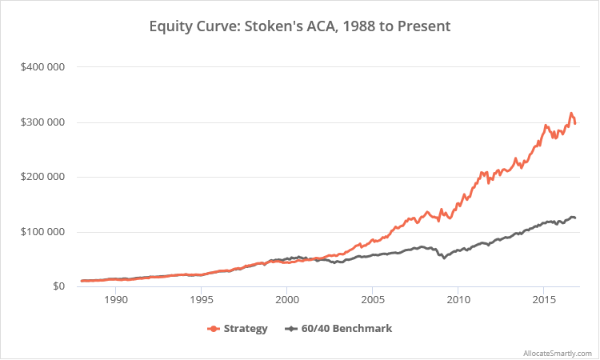
KeymasterDick Stoken ACA Strategy
Source: Survival of the Fittest for Investors
Strategy rules:
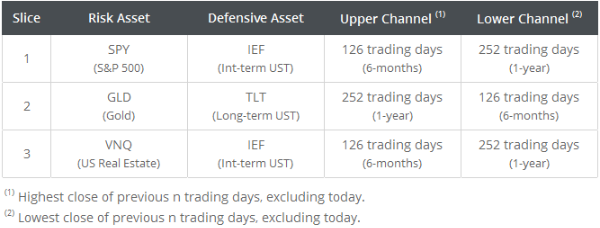
Divide the portfolio into three equal slices (1/3 each). Each slice uses price channel breakouts to choose between two opposing asset classes as shown in the table below.
Go long the “risk” asset at today’s close when the risk asset will end the day above its upper channel (highest close of previous n-days). Switch to the defensive asset at today’s close when the risk asset will end the day below its lower channel (lowest close of previous n-days). Hold positions until a change in signal. Rebalance the entire portfolio either on a change in signal or on the last trading day of the calendar year.
 September 12, 2017 at 12:41 am #107649
Nick Radge
KeymasterGary Antonacci Composite Dual Momentum
Source: Risk Premia Harvesting Through Dual Momentum.
Strategy rules:
The strategy divides the portfolio into four “modules”, each targeted to a different component of financial markets: equities, credit risk, real estate, and stress. From each module, the strategy uses dual momentum to select either one of two related asset classes, or cash. The four modules and their associated assets are as follows:
[+] Equities: US equities (represented by SPY) or international equities (EFA)
[+] Credit risk: US corporate bonds (LQD) or US high yield bonds (HYG)
[+] Real estate: equity REITs (VNQ) or mortgage REITs (REM)
[+] Economic stress: gold (GLD) or long-term US Treasuries (TLT)1. At the close on the last trading day of the month, calculate the 12-month return of each of the eight asset classes shown above, plus 3-month US Treasuries (BIL).
2. Divide the portfolio into four equally-sized modules (25% allocated to each). For each of the modules, determine the asset with the highest 12-month return (relative momentum). If that asset’s return exceeds the 12-month return of BIL (absolute momentum), go long that asset at the close, otherwise move to cash.
3. Hold positions until the final trading day of the following month. Rebalance the entire portfolio monthly, regardless of whether there is a change in position.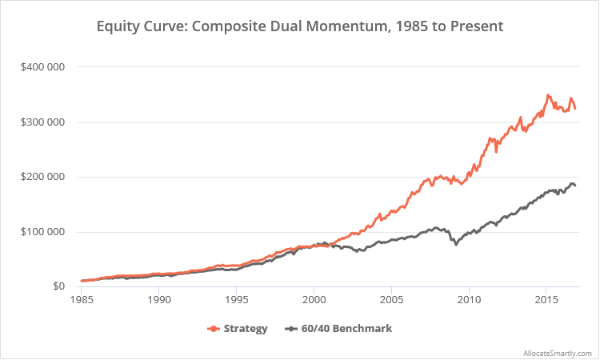 September 12, 2017 at 12:53 am #107650
Nick Radge
KeymasterPortfolioCharts.com Golden Butterfly (Buy & Hold)
Source: The Theory Behind The Golden Butterfly
Strategy Rules:
This strategy is similar in concept to the Harry Browne Permanent Portfolio and Ray Dalio’s very famous and successful All-Weather portfolio. It’s essentially an allocation to each economic ‘season’ that get’s rebalanced once a year.
The fours seasons are:
[+] Prosperity: Equities
[+] Recession: Short-term Treasuries and cash
[+] Inflation: Gold and commodities
[+] Deflation: Long-term treasuriesAsset Allocation:
SPY 20% (S&P 500)
IWN 20% (Small cap Value)
TLT 20% (Long term US Treasuries)
GLD 20% (Gold)
SHY 20% (Short term US Treasuries)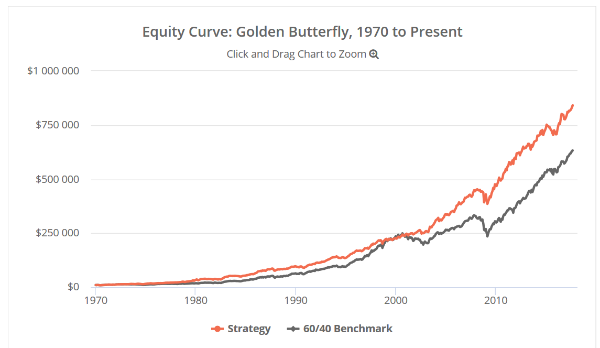 September 12, 2017 at 4:26 am #107652
Nick Radge
KeymasterMebane Faber’s Ivy Portfolio
Source: The Ivy Portfolio: How to Invest Like the Top Endowments and Avoid Bear Markets.
Strategy Rules:
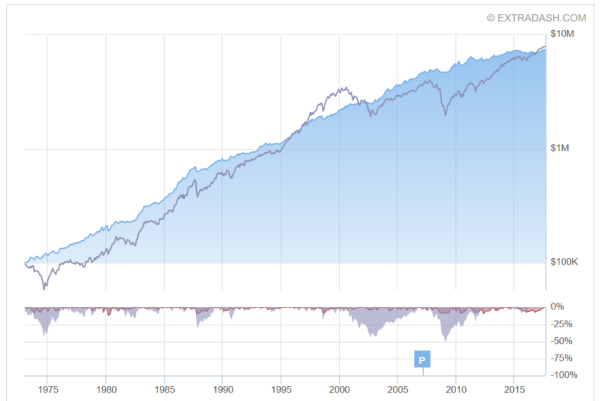
The core strategy follows either a 5, 10 or 20 security portfolio of ETFs and calculated at the end of each month.
Buy Rule: If at the end of the month the last price is above the SMA, and we have no position, then we buy the asset class the next day.
Sell Rule: If at the end of the month the last price is below the moving average, and we have a long position, then we sell the asset class the next day.
Over the years there have been several iterations put forward of the original, including a timing version which appears to provide the best risk/adjusted return.
The two most popular portfolio’s, the Ivy 5 and Ivy 10 have the following constituents:
Ivy 5: BND, DBC, VNQ, VEU, VTI
Ivy 10: BND, DBC, GSG, RWX, VNQ, TIP, VWO, VEU, VB, VTI
Ivy5 vs S&P500
 September 12, 2017 at 5:17 am #107653
Nick Radge
KeymasterStock Traders Almanac ‘Best Six Months Strategy’
Source: Stock Traders Almanac
Strategy Rules:
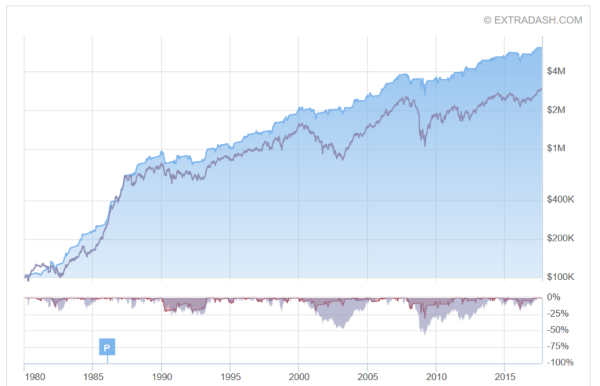
We’ve all heard about the “Sell In May and Go Away” or “Halloween Indicator”. Essentially this strategy is a seasonal strategy that enters the market on November 1st, and exits the market on May 1st the following year.
The strategy uses the MSCI EAFE Total Return Index ETF (EFA) to replicate the performance of largest listed companies in developed markets outside of US and Canada.
Buy Rule: enter the market on the first trading day of November at the open
Sell Rule: exit the market on the first trading day of May at the open
Best Six vs S&P500
 September 12, 2017 at 8:28 am #107651
JulianCohen
ParticipantSorry Nick, just for clarification, with Antonucci’s system when you say rebalance at the end of each month, does that mean irrespective of gains or losses, adjust each holding back to 25% of the portfolio ?
September 12, 2017 at 8:45 am #107654Nick Radge
KeymasterQuote:Antonucci’s system when you say rebalance at the end of each month, does that mean irrespective of gains or losses, adjust each holding back to 25% of the portfolio ?Yes.
September 13, 2017 at 12:36 pm #107655LEONARDZIR
ParticipantIf you are planning on using Antonucci’s dual momentum models there is a free resource that calclulates relative performance over any lookback period
Go to stockcharts.com, go to free charts and one of the charts is labeled performance charts. You can compare any number of entities over different time periods. I got the site from Antonuccis book on his GEM system.September 13, 2017 at 5:52 pm #107656JulianCohen
ParticipantLen Zir wrote:If you are planning on using Antonucci’s dual momentum models there is a free resource that calclulates relative performance over any lookback period
Go to stockcharts.com, go to free charts and one of the charts is labeled performance charts. You can compare any number of entities over different time periods. I got the site from Antonuccis book on his GEM system.Thanks Len. I set it up today
 September 13, 2017 at 8:42 pm #107658
LeeDanello
ParticipantWhy not just do it in Amibroker?
September 13, 2017 at 8:59 pm #107661Nick Radge
KeymasterQuote:Why not just do it in Amibroker?Yes, a simple exploration will produce the same thing.
September 13, 2017 at 9:52 pm #107663LEONARDZIR
ParticipantI brought it up because I was contemplating using some of Antonucci’s systems and had used the free stockcharts performance charts before I joined the mentoring program. Obviously amibroker can be used as well.
September 13, 2017 at 10:57 pm #107664LeeDanello
ParticipantYeah I thought the whole point of this course was to become automated and hence discretionary and bias free.
September 14, 2017 at 1:06 am #107665LEONARDZIR
ParticipantThe GEM SYSTEM (dual momentum) has excellent bactested results and in essence is an incredibly simple monthly rotational system. It is really worth a look and easily coded for backtesting.
Maurice you are lucky with your systems. None of my systems are bias free. -
AuthorPosts
- You must be logged in to reply to this topic.