Forums › Trading System Mentor Course Community › Progress Journal › Ben’s Journal
- This topic is empty.
-
AuthorPosts
-
September 15, 2022 at 8:33 am #115041
TerryDunne
ParticipantHi Ben,
First let me say that I can’t help but be impressed by your enormous rock hard testicles. I know (from painful experience) that my pain threshold is much less than where you are at right now, so I think your tenacity is both admirable and extraordinary. From what I’ve read and my personal experience, those attributes will be very handy for your trading future.
I’d also like to give a slightly different perspective to that of Kate and Glen…for God’s sake stop trading! Not forever, but at least until you get to the bottom of what has gone wrong. While the market is difficult, I’d be surprised if there are others here who have had that level of drawdown. If nothing has really gone wrong apart from the results, maybe the system isn’t right? Imagine having started in, say, 2010. You’d have made something in the region of 25-30% pa and now your drawdown would be mega $$$$$.
Having said that, I suppose it depends on whether this is something you want to do to generate a living, or to augment your day job, or whether it’s just a bit of fun. If it’s for entertainment, then please ignore this post.
Best wishes mate. Just remember all of those stories you’ve read of gun traders who blew up before they became raging successes.
Terry
September 15, 2022 at 7:47 pm #115039LEONARDZIR
ParticipantBen,
i found your post very interesting. I’ve taken a different approach to my MOC. After it went down more then my historic drawdown this year I stopped trading it. A review of my equity curve showed that it fell off a cliff and never looked looked like that in 21 years of backtesting..
I have also been following the results of mean reversion trading on various sites such as this forum and the public portion of Cesar Alvarez’s site and Marsten Parkers forum and this is not a good year so far for mean reversion. I’ve elected to stop my MOC and cut back quite significantly my HFT portfolio.. The question is when to get back in for me. I’ll follow the results of both strategies but I think I won’t get back in until the US market reverses it’s downtrend. Meanwhile I continue to trade other stock systems like TLT and my trend following futures portfolio is having a great month so far and has made up for all my mean reversion losses.September 16, 2022 at 7:07 am #114482SaidBitar
MemberWhen my MOC system reached DD in the range of 35% – 37% back in June this year I reduced volatility on all of my systems (MOC, MRV, MOMO). The aim was not to hit such draw down again and to stop going deeper in DD. To reduce DD by reducing volatility I had to sacrifice some returns. Note that the 35% DD was the deepest in the backtest but there is always first time.
MOC and MRV systems depend heavily on volatility because this is how they make the returns but it was clear that when the market drops fast my strategies dropped faster.
September 16, 2022 at 9:21 am #115043KateMoloney
ParticipantHi Ben,
I ran a little experiment on the backtester as to what my system would have looked like had it started trading April 2022 – present (I believe you started in May?)
Return YTD was -36%. Max DD -39%.Had system started 1/1/2022
Return YTD was 2.5% Max DD -42%What a difference 4 months can make.
Backtest 2005 – 2021 max DD was 32%.
Backtest from 1995 – 2022, there were two periods where max DD was in the high 30% – low 40% region (96 & 97 from memory). Recovery to new equity highs within 4 – 5 months both times.How confident are you in your system and your research ?
Are you certain that your strategy ticks all the boxes in terms of what we are taught here ? (positive expectancy, robustness etc).
Are there any tweaks you could make to the system to make it more comfortable to trade long term ? (not a knee jerk reactional change because of the current drawdown)
September 16, 2022 at 12:08 pm #114483LEONARDZIR
ParticipantPerry Kaufman noted that almost all systems degrade over time with increasing volatility and increasing drawdowns.
I tested my my MOC over the last 21 years and it looked great until this spring when it started acting differently. It has occurred to me that something has changed fundamentally in the American economy and markets. We now have significant inflation, an aggressive fed with rising interest rates and a slowing economy. The longstanding bull market in bonds appears over. These conditions were not present in my 21 year testing period. The last time we had similar conditions in the US was in the 1970’s. I would love to know how mean reversion did in the 1970’s. Meanwhile I’m content to follow my MOC on the sidelines to see if turns profitable. I hope we aren’t entering a period like the 70’s The Dow went up about 5% from 1969 to 1980.September 16, 2022 at 12:36 pm #115044BenOsborn
ParticipantThanks all, really appreciate the responses.
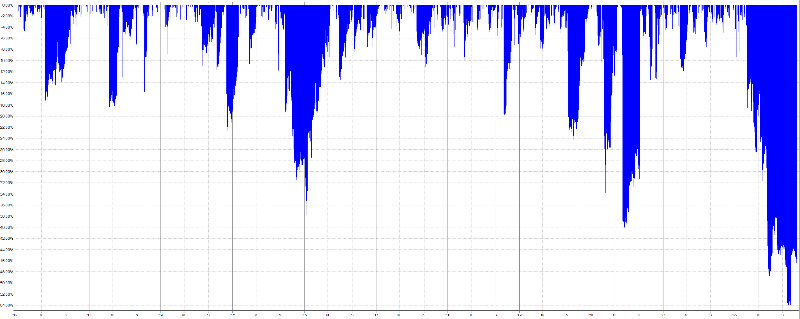
The following is the drawdown for 1990 to 2005

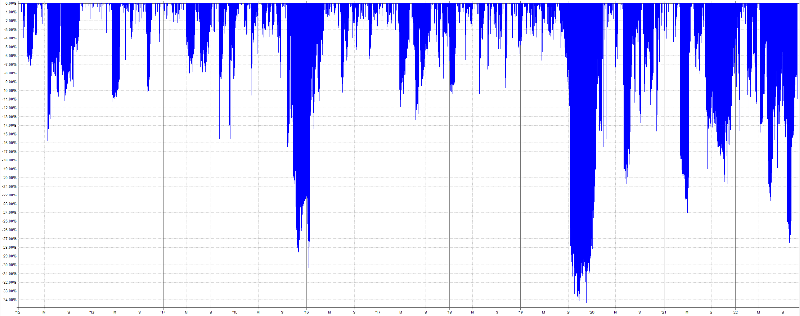
and then 2005 to 2022.

There have been a couple of times where there have been decent drawdowns, just not quite to this extent. Whilst 40% drawdowns aren’t fun, it is what it is. Once I have gone over 50%, I start to wonder where will it stop.
Kate, you are right about the start date bias, any other year in the last few years I would have been handing in my resignation for my day job. Even the difference between starting at the beginning of this year (+3%) to (-53%) starting in April.
I have been considering halving the position sizing an increasing the number of positions. The max drawdown is less.

Overall it is a pretty simple couple of systems that were developed with Nick and Craig. I have been looking at different filters to adjust for things such as increased volatility etc. Some do make small changes of a few % here and there in respect of CAGR and drawdown.
The above graphs exclude the short system which in theory would have made a positive difference had I been trading it the whole time.
PS – Terry you make me laugh
September 16, 2022 at 8:32 pm #115042LEONARDZIR
ParticipantTerry,
You made a very important point about the goals of your MOC. Context is very important. For me, I traded it for extra income. It was easy for me to stop trading my MOC for now since the majority of my trading involves longer term systems and the extra income for me is really not crucial.September 16, 2022 at 10:27 pm #115045Nick Radge
KeymasterLen,
Test the system in the early 90’s. That was the last time we saw aggressive interest rate rises. You should see similar drawdowns to what we’re seeing now.September 16, 2022 at 10:59 pm #115046LEONARDZIR
ParticipantNick,
That would be helpful. Does Norgate data go back to the early 1990’s?
LenSeptember 16, 2022 at 11:48 pm #115047BenOsborn
ParticipantThe platinum package goes back to 1990.
September 17, 2022 at 2:12 am #115048LEONARDZIR
ParticipantThanks Ben. I also have the platinum package.
September 30, 2022 at 11:43 pm #114484BenOsborn
ParticipantSeptember 2022 Performance
US
Combined MOC -19.46% (58.5% DD, -53.88% since inception (late March 2022))Quick and dirty breakdown (as I don’t have exact separate stats):
MOC1 RUI -2.92%
MOC1 RUT -5.87%
MOC2 RUI -3.32%
MOC2 RUT -5.76%
MOC Short -1.36%It is what it is!
October 31, 2022 at 9:47 pm #114485BenOsborn
ParticipantOctober 2022 Performance
US
Combined MOC +14.85% (52.65% DD, -47.04% since inception (late March 2022))Quick and dirty breakdown (as I don’t have exact separate stats):
MOC1 RUI 1.56%
MOC1 RUT 0.78%%
MOC2 RUI 4.69%
MOC2 RUT 4.69%
MOC Short 3.13.%
November 13, 2022 at 1:03 am #114486BenOsborn
ParticipantI have been playing around with different ranking methods this weekend for my combined MOC systems with some interesting results. Comparing my current ranking method to a new method that I am considering shows two very different drawdown profiles, especially when it comes to this year. Looking at the results for the past 10 years as an example, the new method that I am considering shows a 20% lower max drawdown. The CAGR for the new method is 5% lower.
Breaking the systems apart, I noticed that the new ranking method made more of a difference on Russell 1000 strategies. So I also ran a test that looked at ranking the Russell 1000 strategies with the new method and Russell 2000 and other strategies with the old ranking method. This resulted in a 15% lower max drawdown and an increase in CAGR by about 15%. The combined equity curve also looks a little smother than running every strategy on the new method too.
Do others use different ranking methods or tend to stick to the same method?
Current Ranking Method DD from 2012

Potential New Ranking Method DD from 2012

Combined Ranking Methods DD from 2012

November 13, 2022 at 2:29 am #115204KateMoloney
ParticipantI run the same rules for each universe.
The only thing I might change is the stretch e.g slightly higher stretch for the R2000 vs R1000.
Did the same exercise as you a while back and like you found that a new ranking improved the drawdown on one of the systems. Decided not to go ahead with it as further testing disproved the theory.
You’ve got to figure out what risk/reward you are willing to accept … and as long as its a robust system …

-
AuthorPosts
- You must be logged in to reply to this topic.