Filtering Out The Noise
The stock market is a chaotic place. With thousands of stocks making moves in ways that can seem random even at the best of times, separating winners out from the background noise can feel like an overwhelming task.
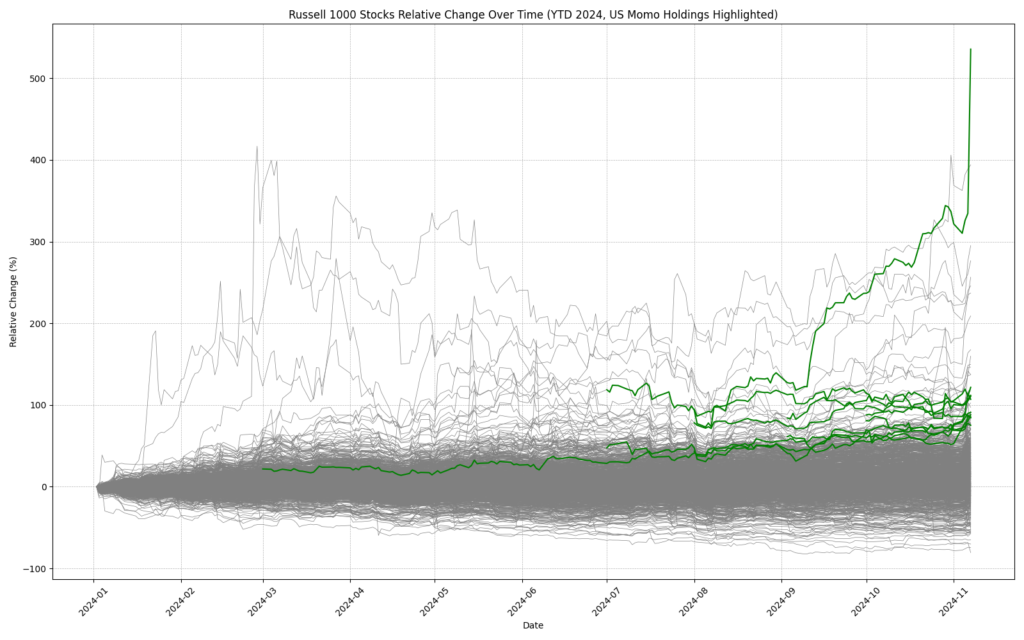
Our US Momentum strategy runs on the Russell-1000 universe, which represents the top 1000 US stocks by market capitalization. The chart below plots the relative YTD change of all 1000 stocks on the Russell-1000.

This chart, unreadable as it is, demonstrates the tremendous amount of noise on the index. It also demonstrates that the vast majority of changes are distributed fairly evenly between +/- 75%. In fact, the median YTD change of individual stocks is only 3.56% and the average is 6.59%. (The overall index itself is up just under 25% YTD due to the market-value-weighted calculation of its performance).
Given that the majority of stocks here display lacklustre performance, how do we identify the strongest signals out from the pack, and more importantly, how do we identify those that will continue to move? Well firstly, we let the computer do the work for us. I don’t have the time or patience to be sorting through 1,000 charts on a regular basis; that is far too many decisions for any human to make, so we write algorithms to sort through the chaff for us. Then, we thoroughly backtest those algorithms on historical data, to identify patterns and trends that present the best possibility of continued performance.
Following this process, you can see the current US Momentum holdings isolated from the pack below. As of this morning, the US Momentum portfolio is up +70% YTD.

If you’re interested in investing with our US Momentum strategy and having the signals picked out for you, take our free two-week trial for full access to all portfolio signals.

