Combining Turnkey Trading Systems
Combining turnkey trading systems was a topic we began to discuss in our last article, whilst answering a readers question. You can read that article first Combining Trading Strategies to Diversify Your Portfolio
I made the point that as no re-balancing had been done, the portfolio becomes more and more lopsided to the best performing strategy and creates more volatility.
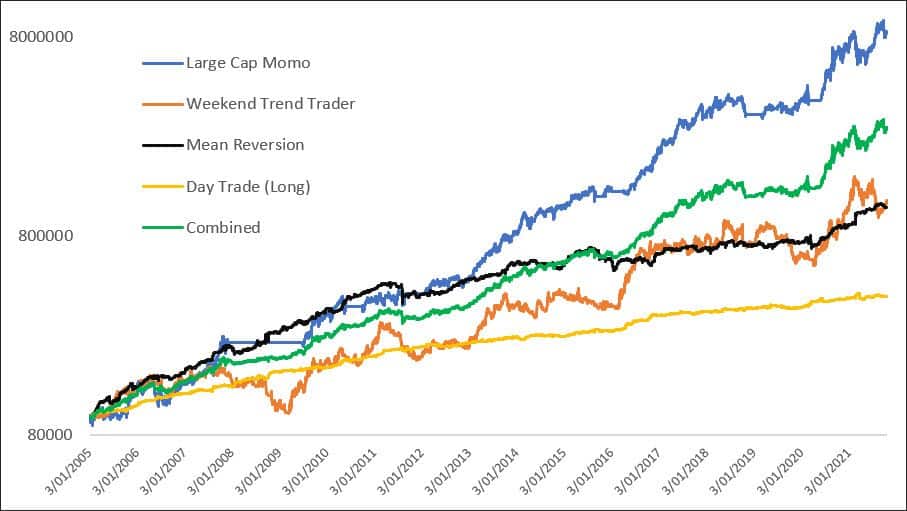
Equity Growth Chart
Below is that equity growth chart. All strategies combined showed a CAGR of +22.00% with a maximum drawdown of -24.39%. Not too bad in the scheme of things. But I’d suggest the volatility would continue to pick up, as would the maximum drawdown.

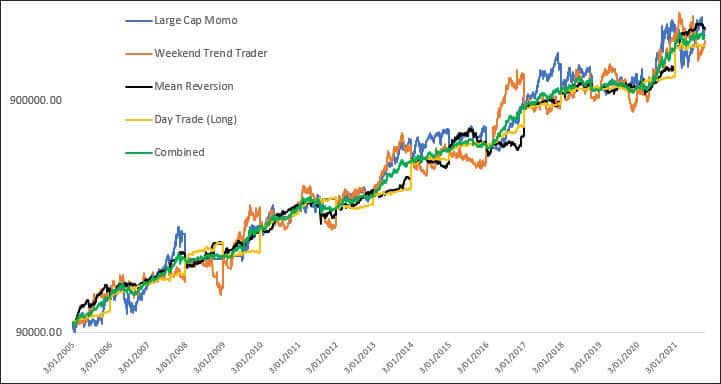
Today we’ll run the same exercise but this time we’ll re-balance the account annually. In other words, profits from the best performing strategies will be fed back into the worst performing strategies and each year each strategy will start with the same dollar allocation.
*Important caveat: the following is calculated based on daily equity changes but has not taken into account adjusting positions. As such, this data should be taken as a general example of concept that may differ in real-time.

We can see that all strategies ‘more or less’ track each other but we can also see over and under performance spikes within individual strategies.
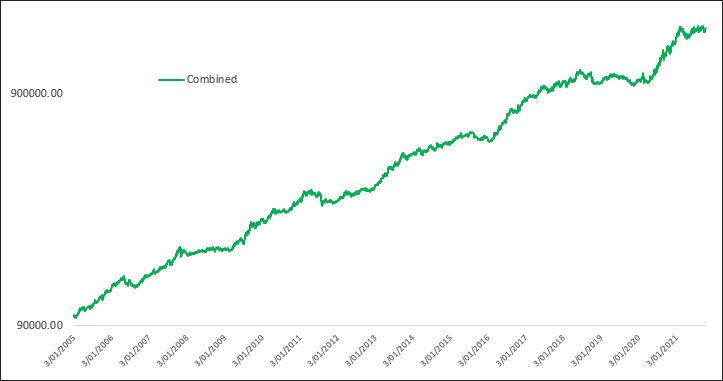
The following chart is the equity growth of all strategies combined on its own.
It offers much smoother equity growth and less reliance on a singular strategy. The CAGR drops from +22% to +18.5% but importantly the maximum drawdown drops rapidly from -24.39% to just -14.65%.

In a world where success comes from longevity, i.e. sticking with a strategy during periods of under performance, it’s sometimes best to forgo bigger returns with larger volatility.
A good measure of performance is a high risk adjusted return. Specifically if the CAGR is equal to, or better than, the strategy’s worst historical drawdown (known as the MAR ratio).
Combining the Four Turnkey Strategies
Combining the four turnkey strategies without re-balancing has a MAR ratio of 0.88. Which is not too bad. However, when the portfolios are re-balanced annually, the MAR ratio jumps to 1.25.
The MAR ratio of Buy & Hold?
0.16.


