Building A Day Trading System
Effective Day Trading System
I received lots of questions after my recent article, How I Manage Day Trading where I discussed my daily process. Today we’ll look at applying simple techniques to build an effective day trading system.
I believe in doing things differently. If a popular method is touted and taken up by the masses, it’s less likely to work into the future.
For example, the Bollinger Bands I use for my ASX trend following system aren’t your standard, run-of-the-mill bands. Mine are tweaked enough to be different in design and construction, and I’m not talking about lookback lengths or standard deviation levels.
So when researching new ideas I’ll take various indicators and turn them upside down, spin them around and look for something new.
ADX indicator
Let’s take a look at the ADX indicator which was designed by Welles Wilder in 1978. A lengthy discussion can be found HERE , but in summary the ADX is used to measure the strength of a trend, not the direction. It’s commonly suggested when the ADX is above 30, the market is trending. When below 30 the market is range bound or changing trend. Combining the ADX with a trend filter is how it’s generally used.
So let’s go left field and try the following idea…
Calculate the ADX for the last 5-days. If the reading today is greater than yesterday, and the reading today is greater than 5-days ago and the reading today is greater than 10 days ago, we’ll buy a dip tomorrow.
To calculate the dip, take the Average True Range (ATR) of the last 5-days and subtract it from today’s low. This is known as the ‘stretch’.
We’ll then rank the signals using the Rate of Change (ROC) over the last 5-days. Then, using the Pattern Day Trader margin, we’ll use a maximum of 40 positions and allocate 10% capital to each.
Any positions opened during the day will be exited ‘market on close’.
Russell-1000 Universe
We’ll test on the Russell-1000 universe using current and historical constituents from the Norgate database. This will remove survivorship bias. Commissions are $0.005 per share or minimum $1.15. Test start is January 1999.

On the surface that looks like a reasonable starting place.
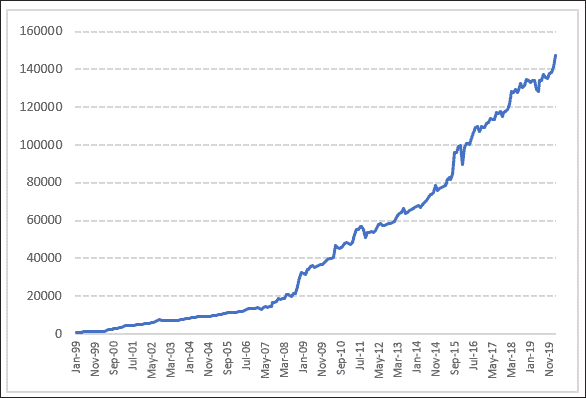
CAGR: 26.7%
maxDD: -14.0%
# Trades: 12,262
Win%: 55.6%
W/L Ratio: 1.13
PFactor: 1.41
Sharpe: 1.79
If we look a little closer there are some interesting traits, many of which are quite common with these strategies and why I choose to trade similar ones.
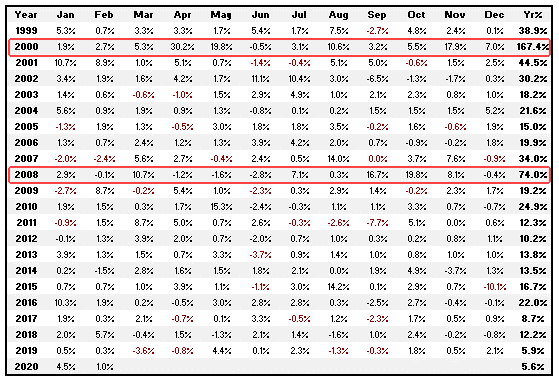
The following monthly return breakdown shows that even though this is a ‘long only’ strategy, major down years have been quite profitable. 2000 and 2008 both showed solid returns even though the broader market fell sharply.

How is it possible that a ‘long only’ strategy can generate decent returns in down markets?
Because people overreact on negative news or overreact excessively during bear markets. Overreaction heightens volatility which is caught by the ‘stretch’, usually early in the session.
‘Amateurs open the market. Professionals close it’.
In summary, this is a different way to look at a popular indicator and incorporate it into your strategy.


