Best Market Conditions To Invest?
It’s no secret that I’m going through a drawdown at the moment. It’s not the first and I’m sure it won’t be the last.
The more important question is why? After all, if you can’t answer the why, you’ll find it very uncomfortable to continue with the process.
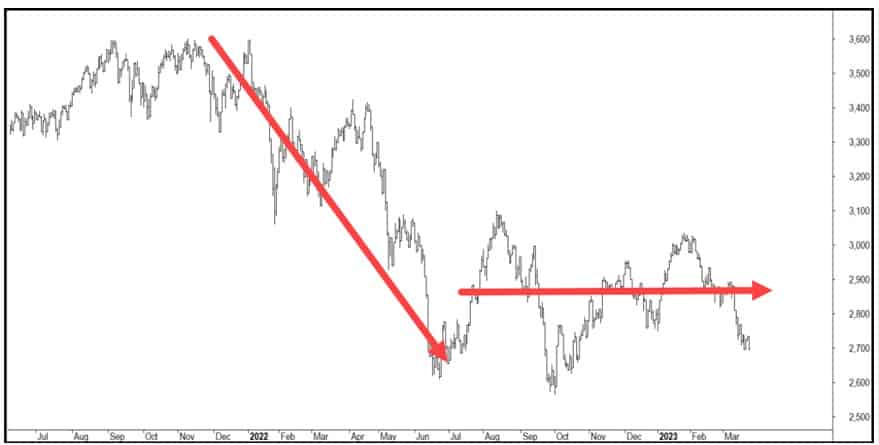
In my case its obvious and why I’m not concerned about it. The chart below shows the ASX Small Ordinaries, which is where most of my trend following assets sit, over the last 18-months.
Downtrends are really an issue with ‘long-only’ trend following. Yes, there will be some giveback, but generally it will be limited. A sideways market however, is a very different beast. One that sucks you in, only to spit you out then repeat.

This brings me to the topic of today’s newsletter and which has been an active discussion on my Twitter feed.
Why don’t you just wait for better market conditions they say?
Priceless advice…
So my question to my avid followers was; define what better conditions actually means?
And as expected I got a lot of logical ideas. But here’s the thing, for better or worse, there’s usually still a disconnect between logic and reality.
If there wasn’t, all of us would be rich from trading.
Let’s take some of those ideas to determine better market conditions and put them to the test. Here’s a capsule summary.
$VIX < 28.5
Trade long only when Volatility Index ($VIX) is below 28.5
$VIX Trending Down
Trade long only when the Volatility Index ($VIX) is trending lower.
$VXX Trending Down
Trade long only when the Short Term VIX Futures ETN is trending lower
3/6/9/12 mth Momo
Trade long only when the market 3, 6, 9 and 12 month momentum are all positive
55 > 200 SMA and Trending
Trade long only when the markets 55 day average is greater than its 200 day trend and both are trending higher
ASX SuperTrend
Trade long when the market SuperTrend indicator is positive. Google it.
C < $XNV SMA
Trade long when the ASX Inverse ETF is below its 100-day average
C > 200 day MA
Trade long when the market is above its 200-day moving average
Foundation
What I currently use and have used since 1998. Don’t ask.
Grant Hawkridge
@granthawkridge is a solid analyst with some interesting ideas. Trade long when the Cumulative NYSE HiLo is trending up and VIX is below 28.5
NYSEHL Trending
Trade long when the Cumulative NYSE HiLo indicator trending up
XAO 52wk HL > 10 SMA
Trade long when the ASX 52wk HiLo indicator above its 10-day average
XAO 52wk HL > 100 SMA
Trade long when the ASX 52wk HiLo indicator above its 100-day average
XAO 52wk HL Trending
Trade long when the ASX 52wk HiLo indicator trending higher
Now that we have defined what so-called ‘better market conditions’ are, we can overlay these on a strategy (ideally various strategies) to gain an insight into the effectiveness.
Step 1
For this exercise I will use our Growth Portfolio, which I have traded since the late 90’s and has been a stalwart portfolio within The Chartist since 2006. Trish and I continue to use it today to manage a portion of our retirement funds. The Growth Portfolio is loosely aligned with the BBO strategy from Unholy Grails (page 118)
Step 2
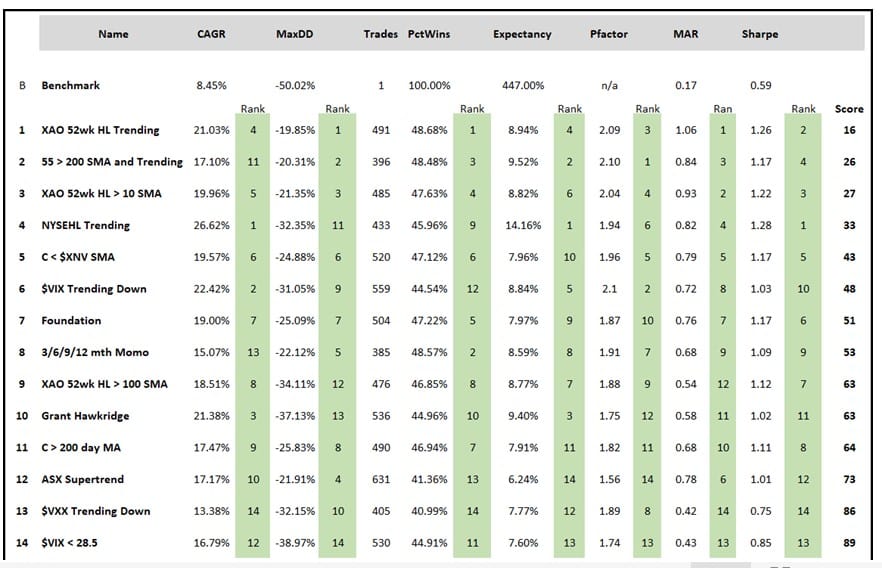
After running the test back 20-years, I then ranked each performance metric where the best metric was ranked 1 and worst ranked 14. The individual ranking are shaded green. I then added the cumulative rankings to create a score where the regime filter with the lowest score is, in theory, the best risk/adjusted return profile.

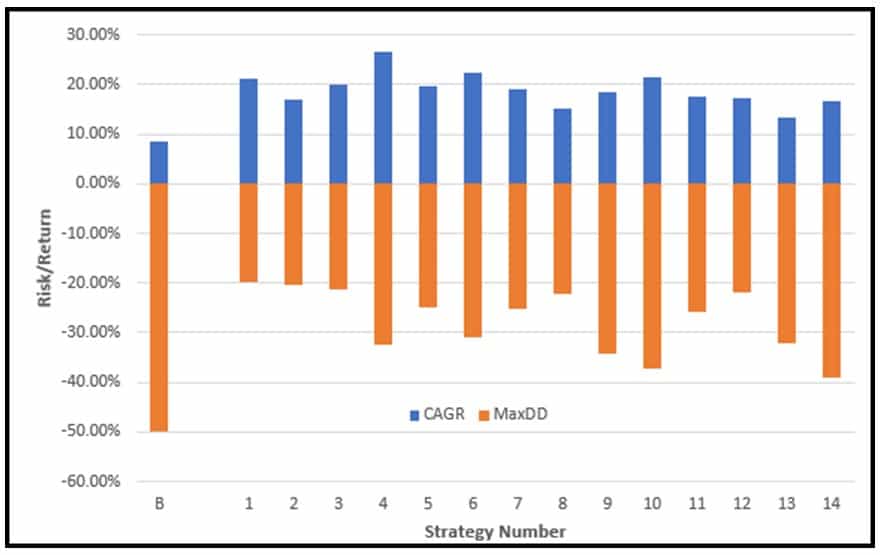
The image below is a visual representation of each strategy’s (across) risk/return.

While all regime filters do their job, some provide better returns and some provide lower drawdowns. It then comes down to the individual’s risk tolerance to chase the appropriate return. For example, using the NYSEHL Trending provides the highest return at 26%, but it comes with a 32% drawdown.
There are many more examples of regime filters to determine best market conditions, but at the end of the day, drawdowns are inevitable regardless. As is said, the best loser will be the long term winner.


