ASX Update October 2018 by Nick Radge
ASX Update for October 2018
Our long term of the ASX remains unchanged; a corrective pattern higher has been unfolding off the 2009 lows, albeit at a much larger degree.
Numerous headwinds remain, specifically:
Sentiment continues to weaken.
Banks to remain under pressure on housing weakness.
More evidence suggesting a cyclical high is close.
Cost cutting may have run its course, which has been the driving force for earnings.
Main Traits
One of the main traits that has changed is strength. It has started to be associated with declining volume with weakness accompanied by exactly the opposite – increasing volume. This is not conducive to higher prices – at least not sustainable.
Morgan Stanley are especially cautious and even suggest that there are reasons to be thinking in terms of this move being the early stages of a bear market.
The technical picture here doesn’t contradict this view.
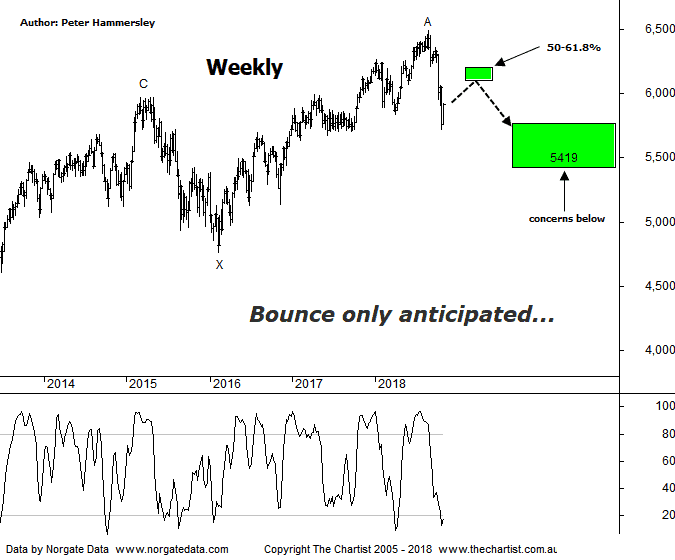
Bigger picture (see weekly chart below) it appears that a combination pattern is unfolding which allows for further weakness before a strong leg higher kicks in.
An A-B-C correction off the 2009 lows terminated in March 2015 with the subsequent retracement likely completing an intermediate degree wave-X. The main reason for this more complex labeling is that the retracement lacked in terms of time. Compared to the prior leg which always opens the door for a more complex pattern to unfold.
From the low of wave-X price action was for the most part overlapping in nature providing confidence that the pivot high made in late August this year completed another wave-A.
The question now is whether we are going to end up with a Double zigzag or a Double Three.
It’s too early to ascertain at this stage although we do have a line in the sand to concentrate on, which is the typical retracement zone of the whole leg higher from wave-X. If the lower boundary of that target at 5419 is overcome, then the more bearish Double-Three should be the way forward which would allow for a continuation down toward a target area between 4800 – 4539.
On the flipside, a 3-wave movement down into the target area either side of 5500 followed by strength could result in another multi-month trend higher as a minimum.
This should eventually reach all-time highs and even beyond, albeit still within a larger corrective pattern. The smaller degree patterns via the daily chart will provide the big clue as to which correction is going to unfold. Either way, over the short-term there is scope to head up toward 6100 – 6200.

Peter Hammersley provides ASX updates each evening for The Chartist.


