An Effective Mean Reversion System – Part 2
I laid the foundation for effective mean reversion trading, in Part 1.
I’ll build upon that now with a specific set of rules then test the outcome.
In layman’s terms the rules are:
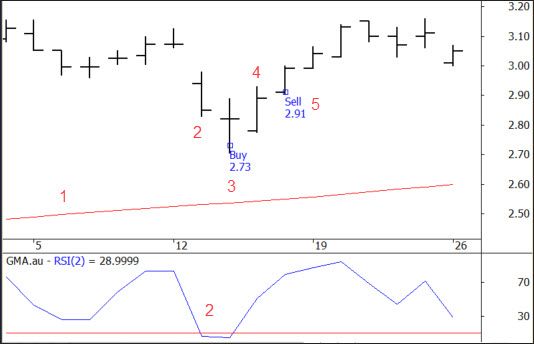
When a stock is trending higher look for a heavily oversold point. Once an oversold level is attained, place a buy order below the market for the following day. If that order is filled, await the first higher close then exit the position on the next open.
Here’s how it looks…

Rules for an Effective Mean Reversion System
1. Define the upward trend of the stock using a 100-day simple moving average. If the stock is above that average then it’s deemed to be bullish.
2. Look for a pullback in that trend using a 2-day RSI. When that falls below 10, the stock is considered heavily oversold.
3. Rank any candidates using Rate of Change and select the top 5.
4. Calculate the Average True Range (ATR) for the prior 10 days. Subtract this from the current low and place a LIMIT buy order at that level for tomorrow. This is known as the ‘stretch’
5. If the LIMIT buy level is met, then await for the first higher close.
6. Exit the position on the following open.
Let’s now put the theory to the test using the following assumptions:
Universe: ASX All Ordinaries Index + historical constituents (2020 symbols).
Range: January 1999 – September 2019.
Comm’s: $6 or 0.08% which ever is higher.
Dividends: Excluded.
Interest: Excluded.
Liquidity: Volume > 300,000 average for last 5-days and cannot exceed 10% of
days total volume.
Position: 5 positions of 20% account value
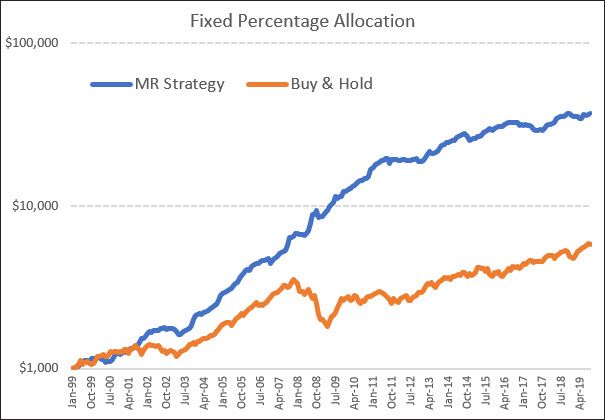
Here’s the equity growth chart:

Performance capsule:
CAGR: 19.1% (Buy and hold = 8.8%)
MaxDD: -15.3%
# Trades: 1786
Win%: 67.8%
W/L Ratio: 0.96
PFactor: 1.96
Win Months: 75%
Loss Years: 1 (2012)
This mean reversion strategy, with minimal rules and linear parameters, has shown some solid results. Drawdowns are in the 13% – 15% range which is palatable.
Useful links relating to this article:
RealTest code for a similar strategy on both the ASX and US markets is available to purchase HERE.
Trading System Mentor Course details available HERE.


