Trading With Divergence
The world of Technical Analysis is saturated with indicators, oscillators, lines and other weird and wonderful esoteric attempts at finding the Holy Grail. There are a couple of absolutes; price and volume. Together, with time, patience and a level head, these tend to be all we need to be successful in the markets.
There is however one indicator, or method of using certain indicators, that has an extremely powerful edge. This method is divergence.
Divergence is where price moves in one direction and the indicator starts moving in the opposite direction.
There are three published versions of divergence and one other that I call Hidden Divergence that won’t be discussed here. The 3 published ones are known as Type-A, -B and –C. Dr Alexander Elder’s book, Trading for a Living outlines all three types in depth. We are only concerned with Type-A which is the most powerful.
There are numerous indicators one can use to identify divergence, including the MACD, RSI, Williams %R and Stochastic. The principal applies to all but the trick is to stay with one and not be tempted to chop and change. Most indicators are used incorrectly and are why they tend to be futile when used in the real world. In my course, Building a Profitable Trading Plan Using Technical Analysis (available to Members of The Chartist in the Education section) I outline divergence as the only setup that uses an indicator and the indicator of my choice is the Stochastic.
Let’s define the Stochastic:
The Stochastic (Slow) indicator calculates the location of a current price in relation to its range over a period of bars. The default settings are to use the most recent 14 bars (input Length), the high and low of that period to establish a range (input HighValue and LowValue) and the close as the current price (input CloseValue).
This calculation is then indexed, smoothed and plotted as SlowK. A smoothed average of SlowK, known as SlowD, is also plotted. SlowK and SlowD plot as oscillators with values from 0 to 100. The direction of the Stochastics should confirm price movement.
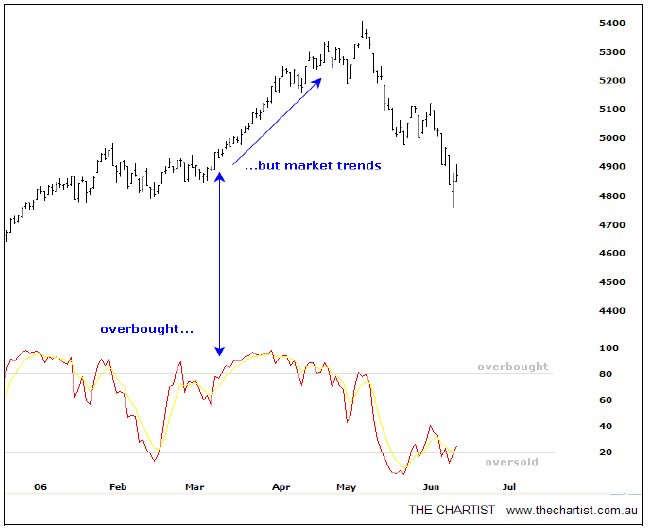
The following chart shows the Stochastic overlaid on the XJO. The indicator is classified as an ‘overbought/oversold’ indicator which means that when it stretched to the upper or lower boundaries the market should reverse. You can see a prime example of where the indicator hits the upper boundary but the market trends powerfully higher. This is where most people come unstuck!
What we need to do however is find the divergences, that is, when the indicator moves in the opposite direction to price. The key rule is that it must be blatantly obvious. If you need to look twice then you’re better off standing aside.
Divergence can be found all over the place and like Elliott Wave its best to be patient and be sure that the pattern exists.
Let’s take a look at some examples; again we’ll start with the XJO.
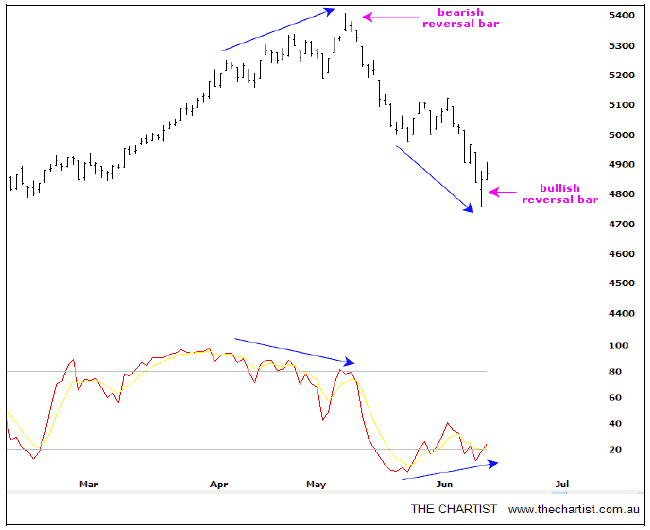
Firstly the blue arrows are showing price moving in one direction, that is, making higher highs at the top left but the indicator is making lower highs. This market top shows a slow rollover before the aggressive selloff. The second divergence is the opposite, although is not a slow rollover, it’s considerably clearer that the indicator has not, and most likely will not, travel as far as price has. As soon as prices start to swing up we expect a reversal. Note also that the absolute high and low have very strong reversal signs on their own. They both squeeze to new highs/lows and close in the opposite direction. Add in the volume consideration and we have a very powerful tool.
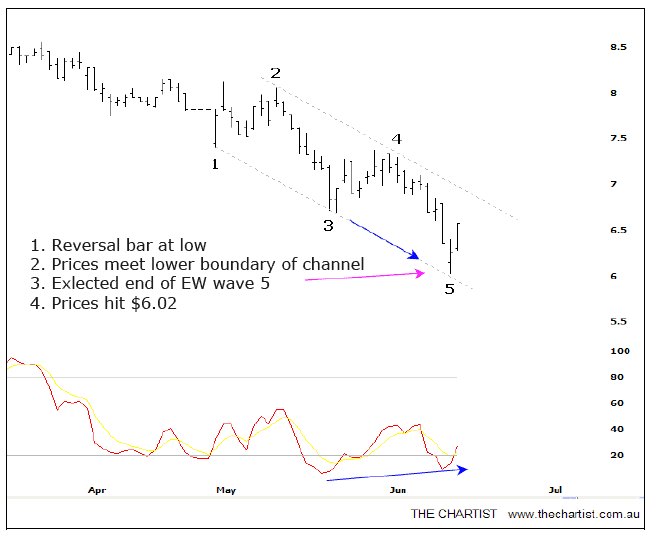
The next chart is ABS. This features a 5-wave structure down. The low was $6.02 but look at the other corresponding technical indicators aligning with those lows plus the bullish divergence. Prices have hit an intra day high of $7.00, a 16% gain in 2 days.
The next chart (ALL) is an example of bearish divergence combined with the Island Reversal. Note the island reversal day was on ultra high volume and we’re always cautious of ultra high volume. Leading up to that major high you can see the market was slowly rolling over. New highs were being made but the stochastic was not confirming.
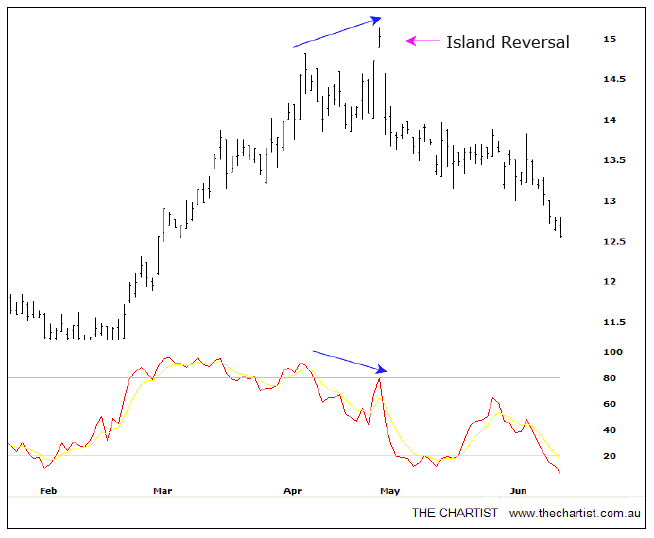
Whether or not you believe in Elliott Wave, this simple pattern of divergence, especially when combined with a reversal day or confirming volume, can make a powerful little tool for a trader. Always remember the golden rule; it must stand out. If you need to look twice then is probably doesn’t contain much force.


