Why It Pays To Diversify your Portfolio
The prevailing wisdom is to ensure you diversify your portfolio.
Buy a selection of shares. Buy some REITs (Real Estate Investment Trust). A few bonds perhaps. And a little cash for a rainy day.
But that’s not what I do.
Rather than invest in a portfolio of shares, I invest in a portfolio of strategies.
Each strategy has a positive expectancy. I diversify across markets (ASX and US), time frames (intra day, multi day and multi month) and styles (trend and mean reversion).
And I firmly believe this is about as close to the Holy Grail as it gets when investing.
Why?
Because every strategy has its time in the sun. And every strategy also has its time in the hole (aka drawdown).
For the average retail investor, putting all your eggs into a single strategy and then watching that strategy go into drawdown is extremely difficult and disheartening.
It entices you to look elsewhere. It induces the Beginners Cycle.
If you’re still looking for the perfect strategy that makes money across all cycles, then keep sniffing that unicorn poop.
Otherwise, try diversifying across different strategies.
Here’s a basic example.
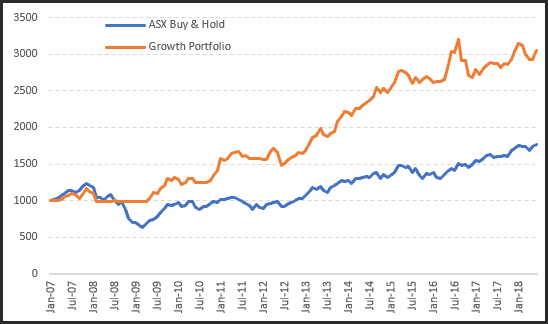
The following equity chart shows a full investment into the Growth Portfolio vs Buy & Hold. There is nothing inherently wrong with this portfolio – it’s outpaced the market by 2x and did an extremely good job of defending capital during the 2008 GFC.
However, if you look carefully, in this brief time window, there are two drawdowns exceeding 16%. One in 2008 and the other in late 2016.
It’s these periods that dissuade investors, especially if they’re starting out.

Now we’re going to do things slightly differently.
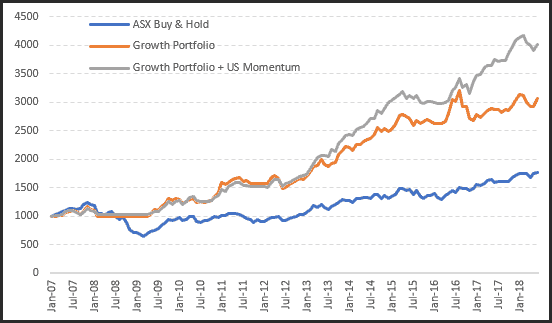
Instead of allocating all our funds to the Growth Portfolio, we’re only going to use 50%, and the other 50% will be allocated to the US Momentum strategy.
These two strategies are very similar; both have a positive expectancy, both attempt to capture trends and they will both revert to cash in sustained bear markets.
However, one trades the All Ordinaries constituents, the other the S&P 500 constituents. So now we get exposure to both the ASX and US markets.

As can be seen, not only do we increase the total return but the two drawdowns have been reduced. The 2008 drawdown is now less than 10%, and the 2016 drawdown declines to 7.4%.
Both of which are extremely acceptable and easier to handle for most.
This is a very basic example. Depending on capital this can be extrapolated across many strategies. For example, I trade five strategies on various time frames and many of the students within the Trading System Mentor Course also trade three or more.
^ Currency fluctuations have been removed for this basic example. The AUD is more or less unchanged for the test period.


