Home › Forums › Trading System Mentor Course Community › Trading System Brainstorming › 5 Days Momentum
- This topic is empty.
-
AuthorPosts
-
April 3, 2016 at 12:13 pm #101472
SaidBitar
Member5 Days momentum is a swing trading strategy that was introduced by Jeff Cooper in his book “The 5 Day Momentum Method”
here are the rules for entry and exit
Entry
share price should be above 50$
ADX >= 35 (to insure momentum and trend)
DI+ above DI- (to insure up trend)
Stoch %k <= 40 (to have weakness) Entry price is above the H of the signal day
if you are not filled on the first day you can try on the second dayInitial stop is a tick bellow the previous Low
Exit after 5 days from the entry (the entry day is the first day)
the strategy sounds simple but i added some additional filters to it so it will become more my taste:
Additional stuff
Index filter 50 day MA of the $SPX
volume filter
and trailing stop 0.5% bellow the lownumber of positions is 10 and the risk per positions is 1% portfolio risk
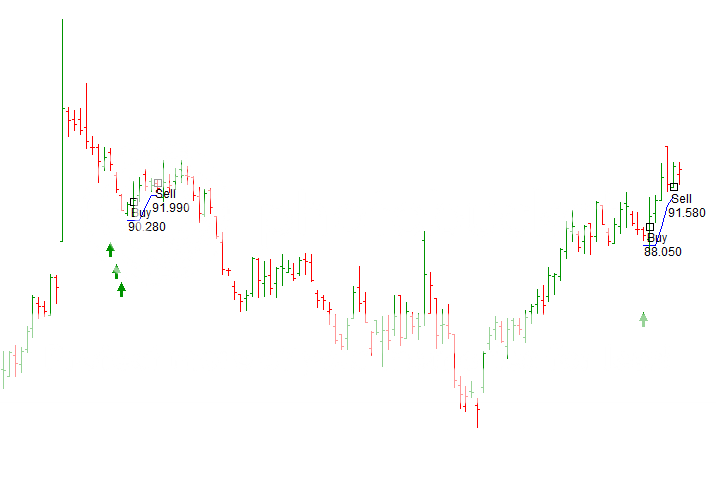
in the above snapshot is the entry signal and the trailing stop with the exit based on number of days in the trade
here is the performance from a single run
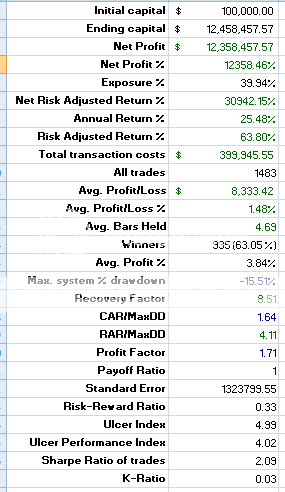
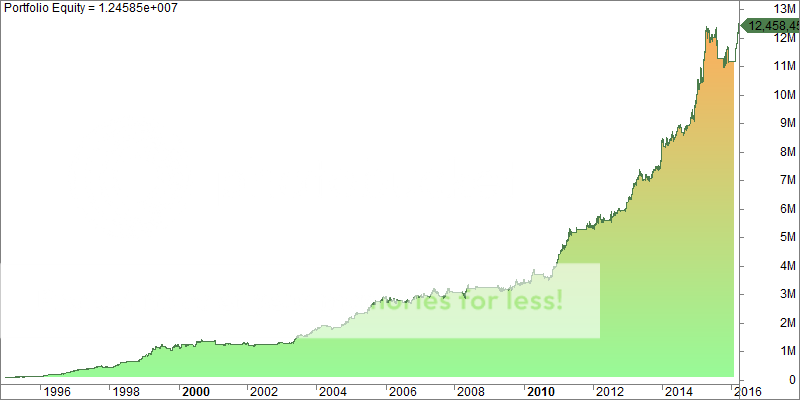
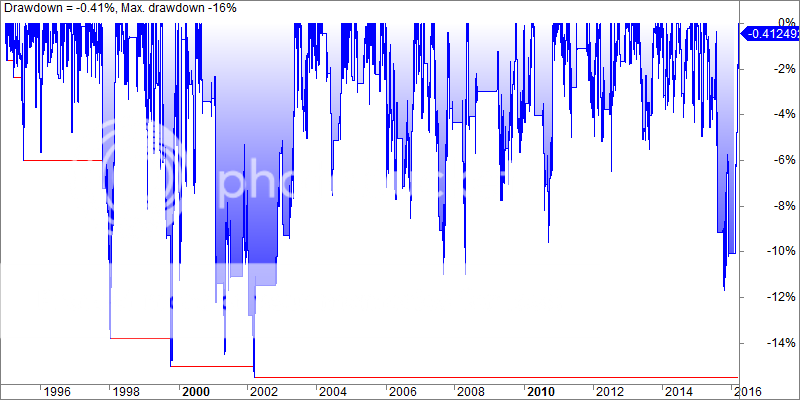
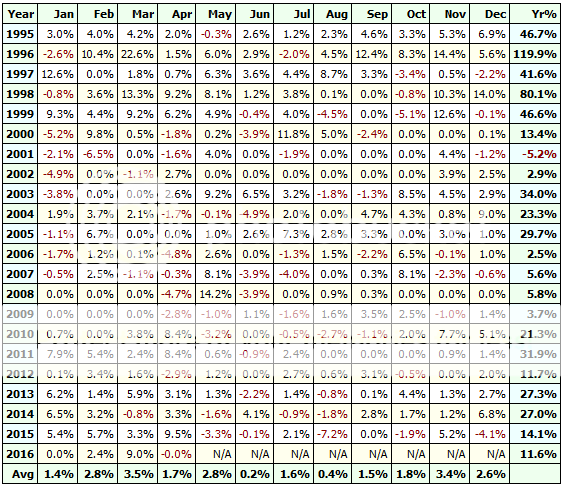
things look very beautiful but personally i will not trade such a strategy for the following reasons:
the positions size is huge some times it can take all the capital in one position
the above results are achieved when ranking and selecting the stocks using positionscore = Stochk valuewhen changing the the above modifications to 10 positions and 10% per position and position score to random then the results start varying.
The strategy will remain profitable but the variations between the results become huge i like the MCs results to be close to each other and not scattered all over the space.the reason i posted this strategy because maybe someone will be interested in it and can modify it and change it to a more stable one.
April 3, 2016 at 12:30 pm #103495SaidBitar
MemberStage II
the same entry conditions just change the stop order from a tick above the high (showing strength) to a dip bellow the Low of the signal bar to show more weakness.
For exit no need for the trailing stop and the exit used is the one that Nick mentioned in Second income strategy i.e. higher close.
the price filter is reduced to 1-100 instead of 50-100in short i used the entry to fit it in a mean reversion style
the Universe is Russell 3000 existing and delisted stocks
Duration from 1/1/1995 till 1/4/2016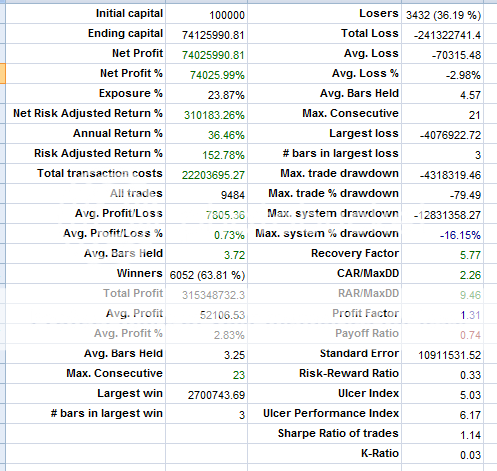
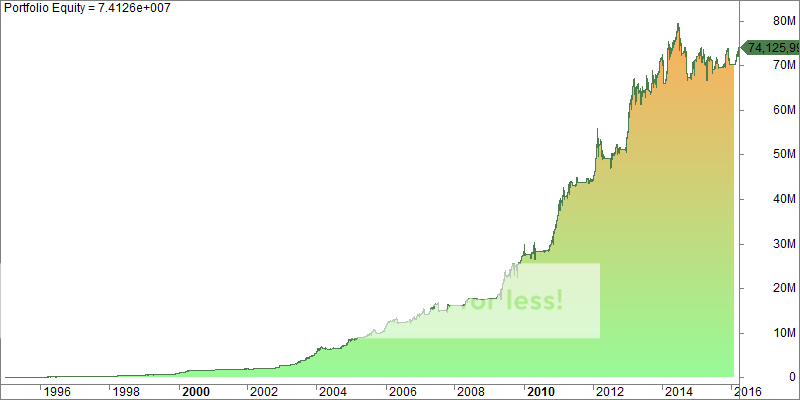
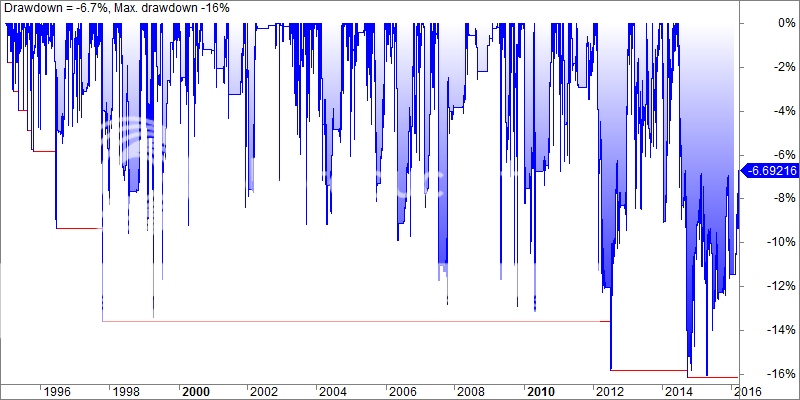
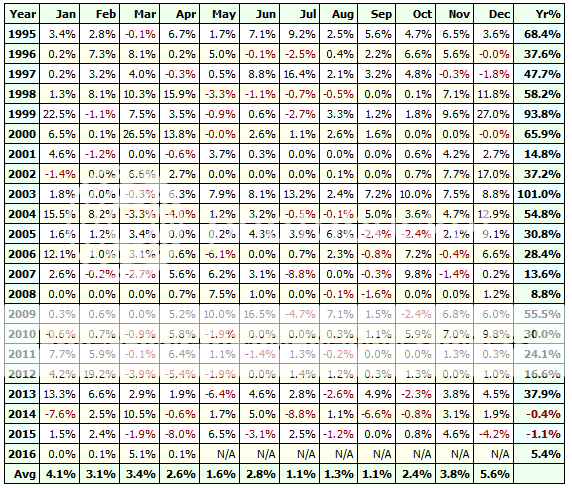
Much better

still it can be improved but as first look it is good
looking at the equity curve it is visible that there are some steps inside it whenever the market is in Bull market the strategy get boosted then it moves sideways or up with a small slope then another bull market and another jump (2009,2011,2013)
April 3, 2016 at 1:14 pm #103502StephaneFima
MemberThanks Said.
Looking at the figures of the second version of the system, do you have an idea why this strategy is not working during 2014 and 2015?April 3, 2016 at 1:17 pm #103503SaidBitar
Memberthis strategy needs strong trends to work this is why it was flat during 2014 and 2015. i think if the ADX value will be lower it will not be as flat.
April 3, 2016 at 1:44 pm #103504StephaneFima
MemberOk. This seems interesting.
I am going to try coding it and then revert to have a chat here on this system.April 3, 2016 at 9:29 pm #103496Nick Radge
KeymasterSome good results there. Thanks Said.
April 4, 2016 at 3:44 am #103505TrentRothall
ParticipantSaid Bitar wrote:this strategy needs strong trends to work this is why it was flat during 2014 and 2015. i think if the ADX value will be lower it will not be as flat.My MR does the same thing over this period.
Wouldn’t you think that it should be good conditions for MR systems? in 2015 the SPX was chopping back and fourth but edging higher for half the year, similar in 2014 but with a more upward momentum. in 2015 on the ASX the movement was a similar choppy action but with a downward bias, 2014 was sideways.
on the SPX my system returned -6.4% and 1.4% in 2014 and 2015
on the ASX it was 18.5% and 51.3% in 14,15.It just seems weird to me. Maybe the SPX is choppier or something. Or maybe the system just suits the ASX better I am not sure.
April 4, 2016 at 4:18 am #103497Nick Radge
KeymasterOur HFT strategy returned 14.5% in 2015
April 4, 2016 at 4:22 am #103498TrentRothall
ParticipantYes i did look at that, I guess its just my system is ‘out of sync’ with the US. In saying tthat it hasn’t done as well in any time period on the SPX, so the system probably doesn’t suit as well
April 4, 2016 at 7:00 am #103507SaidBitar
MemberTrent Rothall wrote:Said Bitar wrote:this strategy needs strong trends to work this is why it was flat during 2014 and 2015. i think if the ADX value will be lower it will not be as flat.My MR does the same thing over this period.
Wouldn’t you think that it should be good conditions for MR systems? in 2015 the SPX was chopping back and fourth but edging higher for half the year, similar in 2014 but with a more upward momentum. in 2015 on the ASX the movement was a similar choppy action but with a downward bias, 2014 was sideways.
on the SPX my system returned -6.4% and 1.4% in 2014 and 2015
on the ASX it was 18.5% and 51.3% in 14,15.It just seems weird to me. Maybe the SPX is choppier or something. Or maybe the system just suits the ASX better I am not sure.
Actually most MRV strategies perform very good during bull years and so does trend following. Me personally I like to see the MRV strategy gave some good results during the years when trend following didn’t
April 4, 2016 at 7:04 am #103508TrentRothall
ParticipantSaid Bitar wrote:Actually most MRV strategies perform very good during bull years and so does trend following. Me personally I like to see the MRV strategy gave some good results during the years when trend following didn’tYeah ok, that makes sense. So it can pick up the slack when trend following isn’t doing as well i guess
April 4, 2016 at 7:13 am #103509SaidBitar
MemberMaybe lower ADX value and lower stochk value will do the trick
April 4, 2016 at 8:28 am #103510StephaneFima
MemberSaid,
What period did you take for ADX, +DI and -DI ? On my side I took the the usual 14 days.
For %K, I included the built-in indicator StochK(8,1), i.e. with no smoothingThe results are pretty bad (CAR between -7% and -3% on the S&P 500 / Nasdaq 100), and I think my code is not right. I have now to check it in detail.
April 4, 2016 at 8:37 am #103514SaidBitar
MemberI used 8 periods for ADX and all
April 4, 2016 at 11:08 am #103499ScottMcNab
ParticipantMany thanks for posting Said. Do you use the commission table (with IB settings) for your backtests ?
-
AuthorPosts
- You must be logged in to reply to this topic.