Home › Forums › Trading System Mentor Course Community › Trading System Brainstorming › 20 Percent Flipper
- This topic is empty.
-
AuthorPosts
-
March 20, 2016 at 3:31 pm #101458
SaidBitar
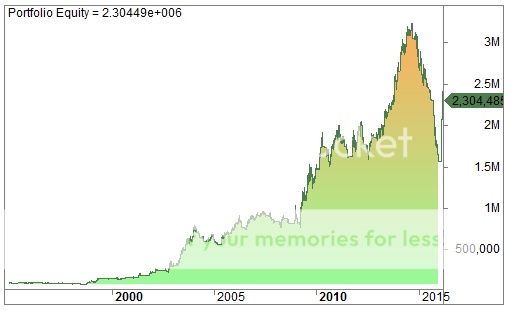
MemberI was testing the 20% flipper, this strategy fascinates me mainly its past performance. There is one video on youtube by Nick for this strategy tested on S&P1500 and with all out in case the Index Filter is OFF.
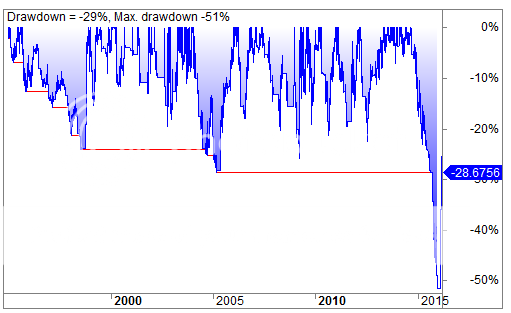
so i set the same settings and ran backtest till last Friday and the results are a bit weird.
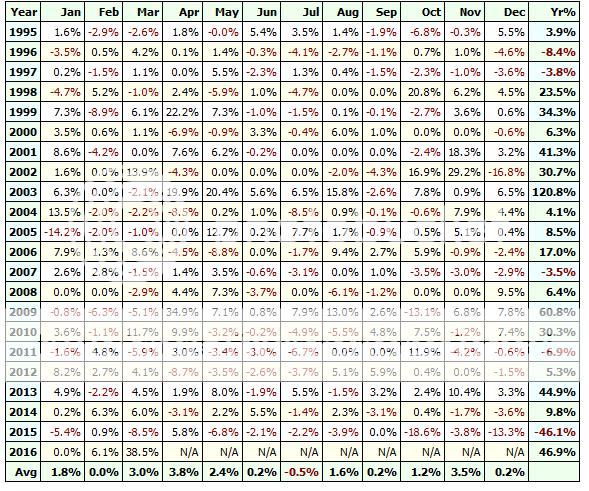
for some reason this strategy had 50% drawdown in 2015 and then almost 50% up in 2016 it only shows how powerful it is.The question is 2015 was a bit strange year but there was not huge bear market so still i do not understand why it made all of this DD, and most probably if i was trading it i would have thought that it is broken since it did not have such drawdown in backtesting before and i would have missed the huge run this year
here are some snapshots to make it clear what i am talking about
 March 20, 2016 at 6:52 pm #103358
SaidBitar
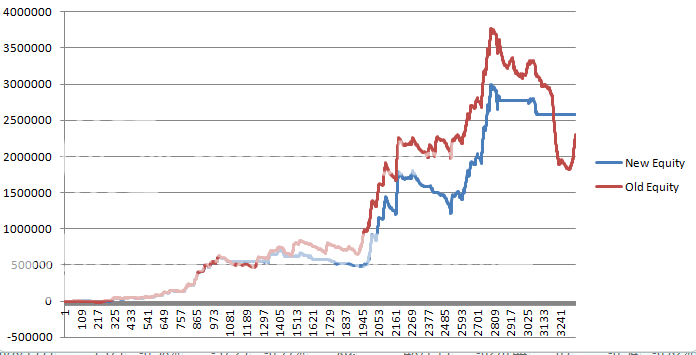
MemberSo with the intention to improve the performance i tried to add one thing that Nick recently was talking about is adding additional filter based on Equity curve.
So i ran one backtest took the results and added MA of 20 periods for the equity curve and if the equity will dip bellow the MA No orders will be placed in the market only on paper to monitor the equity curve and when the Equity crosses above the MA then the new orders will be placed.
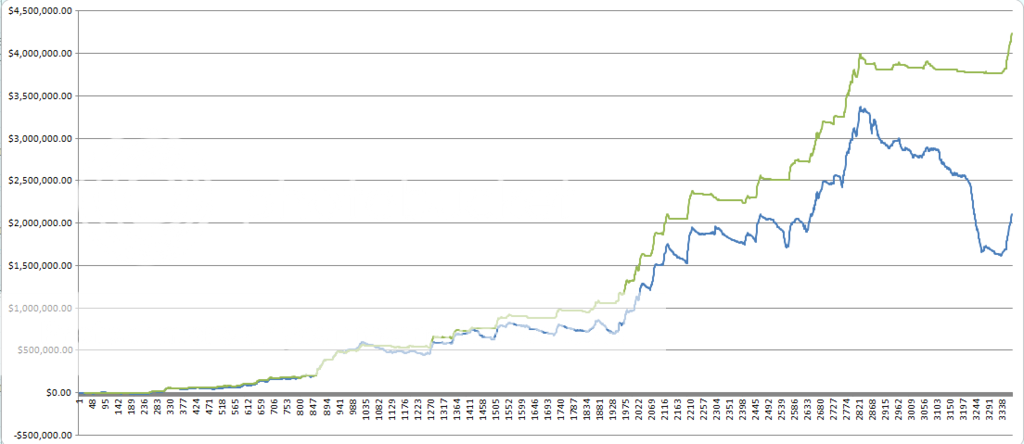
In the image drawdowns look better and i believe the overall system performance will be better.
I am not sure how to add this condition to Amibroker code since Amibroker runs backtesting one symbol at a time then merges all the trades together at the end to generate the equity curve.
March 20, 2016 at 8:50 pm #103366SaidBitar
MemberI made mistake in my previous calculations
Now i made the correct calculations by checking the periods when the system will not be trading and eliminating the entries that fall in this durationthis is the new results
 March 20, 2016 at 9:05 pm #103367
SaidBitar
Memberhere is the excel file it has macro inside it, in case anyone is interested
March 20, 2016 at 10:56 pm #103368Stephen James
MemberI understand you can code an equity curve MA against a single symbol in AB, but not portfolio equity (in standard backtest mode at least).
March 21, 2016 at 1:47 am #103359Nick Radge
Keymaster2015 does seem strange. Looks like the system might be getting caught in the energy meltdown.
March 21, 2016 at 3:00 am #103360TrentRothall
ParticipantWhat do you do in that situation, 1 year ago if you built the system it would have looked good. Does that recent drawdown make it no good now? I imagine you would be stressing once your DD went below 10-20%
March 21, 2016 at 6:59 am #103361Nick Radge
KeymasterI don’t get that drawdown and actually get a +6.9% for 2015 with the current drawdown sitting at 15%.
I also note your equity pre 2000 – looks very flat. Have you used delisted stocks here?
March 21, 2016 at 7:09 am #103362Nick Radge
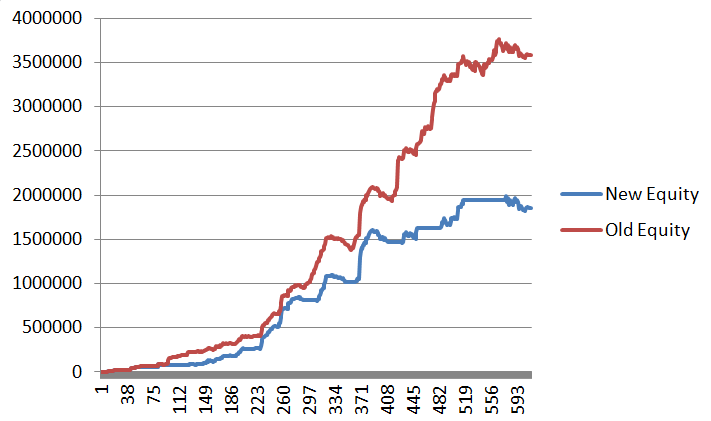
KeymasterMy Growth Portfolio doesn’t like that equity curve filter!
 March 21, 2016 at 8:20 am #103387
SaidBitar
MemberNick Radge wrote:I don’t get that drawdown and actually get a +6.9% for 2015 with the current drawdown sitting at 15%.I also note your equity pre 2000 – looks very flat. Have you used delisted stocks here?
Yes I included the delisted.
6.9% for 2015 that is intresting I will check the code again
March 21, 2016 at 8:43 am #103388SaidBitar
MemberNick Radge wrote:My Growth Portfolio doesn’t like that equity curve filter!
I modified the excel a bit last night so it is possible to add the duration of the moving average
I will attach it later
March 21, 2016 at 11:28 am #103389SaidBitar
MemberMarch 21, 2016 at 9:06 pm #103363Nick Radge
KeymasterI should reiterate that this exercise should not be applied to a trend following system, so ignore my flippant comment above.
March 21, 2016 at 9:18 pm #103395SaidBitar
MemberI checked the code for the flipper
I noticed the following
i am having lower number of trades and exposure
lower profits and higher drawdownsThe code looks OK, now i am sure there is hidden thing over there it will take few days to find out.
But if it is there i will catch itMarch 22, 2016 at 1:11 am #103364LeeDanello
ParticipantSaid, I’m just wondering what your criteria is for entering trades is. Are you by any chance using the zig zag function for establish low points and then entering on a 20% rise from that or are you using some sort of oversold oscillator to signify low/turning points?
-
AuthorPosts
- You must be logged in to reply to this topic.