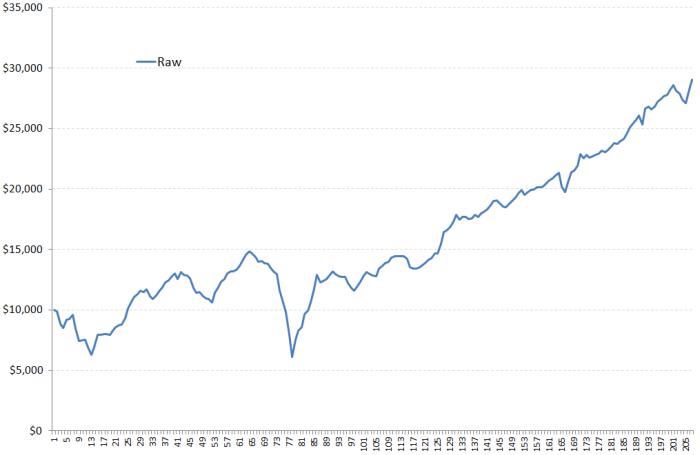
I have been asked about this a few times now so I thought it prudent to at least write my thoughts and outline an example.
Trading the equity curve means plotting a moving average of the equity growth chart. When real equity drops below the average, you stop trading the system in real time yet continue to plot equity in simulation mode. When equity again moves above the average then you start trading real time.
Goal:
– to ensure you’ve stopped trading the system should it start to fail due to lack of robustness or the effects of over optimisation
– lower drawdowns
Caveats
– this method will not stop drawdowns
– should only be used on short term systems that DO NOT exhibit trade clustering
– is not appropriate for trend system or longer term systems
– most people calculate the MA with a post dictive error.
The following chart shows a SPXL ETF strategy that exhibits 200 trades since 2008. Results on other indices or stocks are not overly strong, so we would suggest that (a) this is a single market system
(b) it doesn’t exhibit enough sample to offer confidence in robustness.(although we can use the SPY as a proxy back to 1993 with 660 trades)

However, can we trade it?
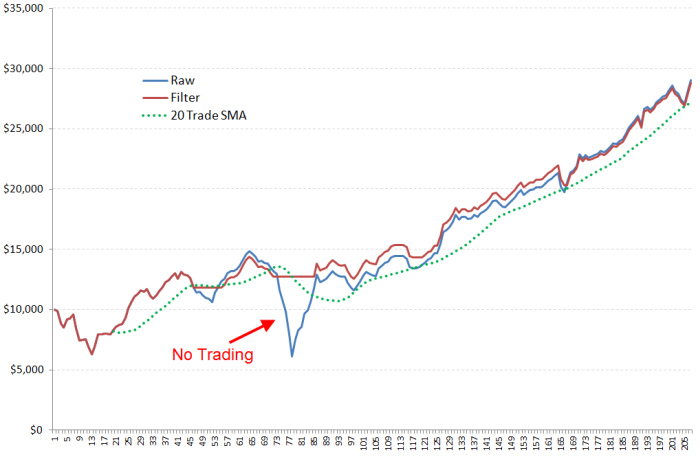
I believe we can so long as we have some trigger to stop and reassess. The next chart shows the same system with a 20-trade SMA (Green) and the subsequent equity curve created by only trading when the equity curve is trending up.

Summary
– The end equity is about $300 lower.
– Drawdown is now $3724 vs $8747 (no compounding used)
– 28 trades are skipped
– we have a clear OFF switch should this system start to fail.
.