4 Ways to Trade Through Drawdowns
A drawdown is a decline in equity measured on a marked-to-market basis. Drawdowns are the ‘cost’ of exploiting a risk premium and cannot be avoided. However, the ability to stay with a strategy during a drawdown is one of the most difficult aspects all traders face. Rather than take steps to adjust or second-guess strategy signals it is better to take a defensive stance with position sizing or capital allocations.
Here are 4 suggested ways of trading through drawdowns:
(1) Adjust Capital Allocation
Investor-A has a risk tolerance that suggests she could handle a 15% drawdown. She wishes to invest $100,000 into Strategy-X yet Strategy-X has an historical drawdown of -25% which is above her comfort level.
She could either (a) avoid the strategy altogether or (b) allocate a smaller portion of her total portfolio so when the inevitable drawdown occurs it will be within her 15% threshold .
Adjusted allocation = Risk Tolerance / Strategy-X Drawdown
= 0.15 / 0.25
= 0.60
Therefore Investor-A should invest 60% of her wanted $100,000 and leave the balance in a risk free investment.
(2) Diversify Strategies
Strategies that rely on serial correlation (prices moving in unison) will be prone to drawdown during non-trending or bearish environments when the strategy is ‘out of sync’ with the market. Unfortunately there are no guarantees on when these periods will occur or how long they will endure.
One way of reducing the risk from trend-following or momentum is to diversify the strategies employed, such as using short term strategies. Short-term strategies could still be focused on trends but the shorter time-frame makes it less correlated to the strategies that are looking for longer-term trends.
Another solution is adding a secondary market to your portfolio such as the US.
Since the March 2009 GFC low in global sharemarkets, Australian shares are up 65 per cent, compared to a 145 per cent gain in global shares in local currency terms and a 210 per cent gain in US shares.
In fact, both global and US shares reached record highs last year and still remain above pre-GFC levels, whereas the Australian sharemarket is around 24 per cent below the record high of 6829 reached in November 2007.
(3) Be Proactive with Position Sizing
Famed Original Turtle Jerry Parker makes a very simple yet potent statement in THIS podcast about dealing with drawdowns. Note: This is quite likely one of the best interviews I have ever heard.
For every 10% your portfolio declines, decrease your position size by 20%
(4) Trade The Equity Curve
Trading the equity curve means plotting a moving average of the equity growth chart. When real equity drops below the average, you stop trading the system in real time yet continue to plot equity in simulation mode. When equity again moves above the average then you start trading real time.
Goal:
– to ensure you’ve stopped trading the system should it start to fail due to lack of robustness or the effects of over optimisation
– lower drawdowns
Caveats
– this method will not stop drawdowns
– should only be used on short term systems that DO NOT exhibit trade clustering
– is not appropriate for trend system or longer term systems
– most people calculate the MA with a post dictive error.
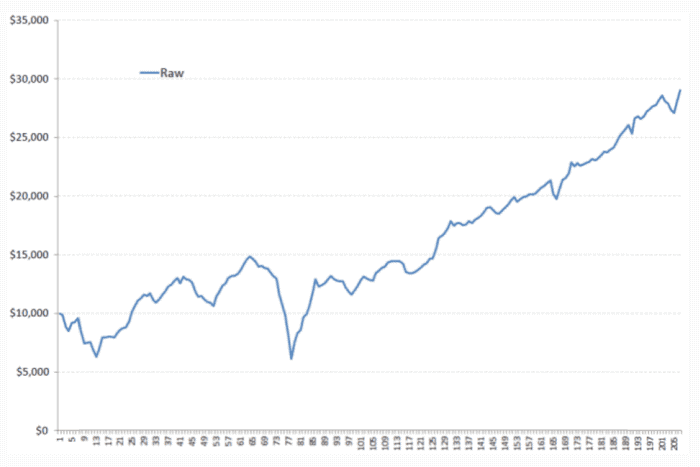
The following chart shows a SPXL ETF strategy that exhibits 200 trades since 2008. Results on other indices or stocks are not overly strong, so we would suggest that (a) this is a single market system
(b) it doesn’t exhibit enough sample to offer confidence in robustness.(although we can use the SPY as a proxy back to 1993 with 660 trades)

However, can we trade it?
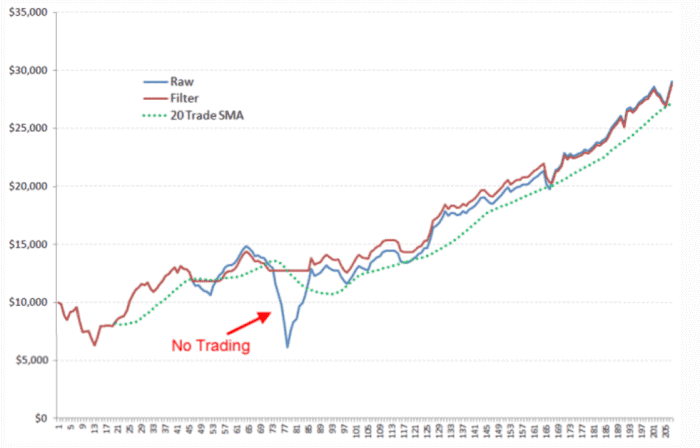
I believe we can so long as we have some trigger to stop and reassess. The next chart shows the same system with a 20-trade SMA (Green) and the subsequent equity curve created by only trading when the equity curve is trending up.

Summary
– The end equity is about $300 lower.
– Drawdown is now $3724 vs $8747 (no compounding used)
– 28 trades are skipped
– we have a clear OFF switch should this system start to fail.


